Hi everyone,
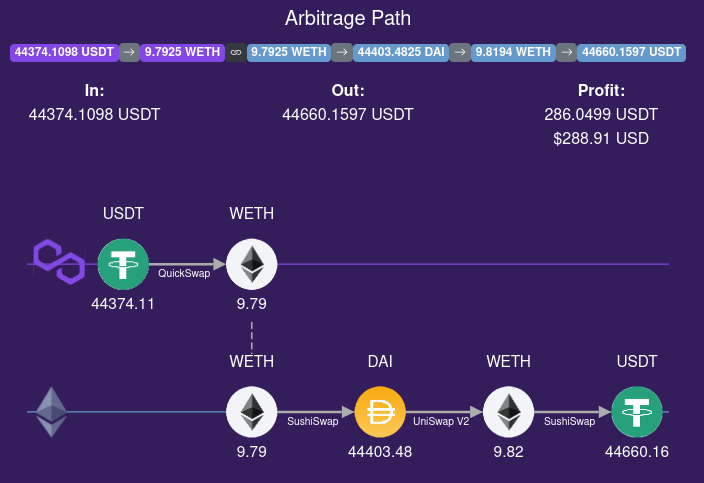
For the ETHGlobal HackMoney 2021 competition, the Semiotic Labs team built Western Gate to measure (but not capture) cross-domain arbitrage. The project monitored Uniswap v2 pools across Polygon, BNB Smart Chain, and Ethereum. E.g. this diagram shows that at one point in time, you could have (maybe) made $289 USDT arbitrage profit across Polygon/Ethereum:
Fast-forward one year, and we are now in the 3rd generation of the cross-domain arb measurement project. We have rebranded Western Gate as Odos.xyz Cross-domain Arbitrage Tracker (CAT). We still only monitor Uniswap v2 pools, but we’ve expanded to monitor eight chains and we search 35M cross-domain arbitrage paths every 12 seconds.
We have previously only stored leaderboard arbs, but, starting last week, we began to record all arb information measured by CAT. There are many interesting questions that can be answered with this data – especially when combined with other data from Flashbots, the mempool, or CEXs. I’ve been collaborating with @shea and @sxysun to prioritize the questions. Below, I summarize our conversations. I marked questions that can be answered using CAT data with ![]() , questions that may require Flashbots or mempool data with
, questions that may require Flashbots or mempool data with ![]() , questions that need historical CEX data with
, questions that need historical CEX data with ![]() , and questions that I don’t know how to answer currently (or could require significant work or planning) with
, and questions that I don’t know how to answer currently (or could require significant work or planning) with ![]() .
.
@shea’s summary:
The highest priority is to validate basic assumptions — sizing the xdomain opportunity and determining if it’s a profitable activity. Concretely:
- What is the (lower bound) TAM of xdomain MEV?

- Is there an incentive to execute xdomain MEV? (Does xdomain MEV unlock novel profits that are greater than single domain MEV)?

A strawman for what this might involve:
- Historical xdomain arb data from CAT (detected opportunities)
- What other kinds of xdomain mev can/should we add?

- Getting a good picture of single-domain for comparison
- There’s also the practical angle of finding people who are already running domain strategies and measuring their profit
- Would be neat to line up historical CEX data with the historical CAT arb paths.

- Could adding the option to swap to a CEX extend some of these paths?
- Would also be interesting to understand what the distribution is of pure DEX <> DEX arb vs DEX <> CEX vs CEX <> CEX
Related, here are notes that I took during a conversation with @sxysun:
-
@sxysun has estimated that bursts of activity (about 5% of blocks) account for the majority (around 70%) of MEV. Can we get a tighter measurement of that?
- Can we get a better measurement of the utility (based on time preference) experienced by traders?
- Can we estimate the welfare that could be achieved by ordering transactions in such a way that the group/batch benefits as a whole? (Versus random ordering or maximal extraction.) You also pointed out that this is similar to what CoW Swap does.
Likely initial outcomes of this research include one or more academic papers, blog posts, and talks. In the longer term, this research could motivate the need to make xdomain markets more efficient. Please get in touch/comment if you are interested in collaborating, or have questions, ideas, or critiques.