Mempool Dumpster is a free mempool transaction archive, brought to you by Flashbots in collaboration with various transaction providers (Infura, bloXroute, Chainbound, Eden, as well as local geth nodes):
# Show the schema
$ clickhouse local -q "DESCRIBE TABLE '2023-09-14.parquet';"

# Get exclusive transactions from bloxroute
$ clickhouse local -q "SELECT COUNT(*) FROM '2023-09-14.parquet' WHERE length(sources) == 1 AND sources[1] == 'bloxroute';"

# Count exclusive transactions from all sources (query takes <1 sec)
$ clickhouse local -q "SELECT sources[1], COUNT(*) FROM '2023-09-14.parquet' WHERE length(sources) == 1 GROUP BY sources[1];"
eden	22460
local	309
infura	133
apool	86
bloxroute	29871
chainbound	20008

# Get details for a particular hash
$ clickhouse local -q "SELECT timestamp,hash,from,to,hex(rawTx) FROM '2023-09-14.parquet' WHERE hash='0x09ec56414462c3980772999e0d27fa0a79dcb667a156e1a1532ed0f5eaa672f3';"
These are the available fields:
$ clickhouse local -q "DESCRIBE TABLE '2023-09-14.parquet';"
timestamp	Nullable(DateTime64(3))
hash	Nullable(String)
chainId	Nullable(String)
from	Nullable(String)
to	Nullable(String)
value	Nullable(String)
nonce	Nullable(String)
gas	Nullable(String)
gasPrice	Nullable(String)
gasTipCap	Nullable(String)
gasFeeCap	Nullable(String)
dataSize	Nullable(Int64)
data4Bytes	Nullable(String)
sources	Array(Nullable(String))
rawTx	Nullable(String)
Have fun, and please share your results, insights and feature requests!
It converts everything including sourcelog files and transaction-data files to parquet.
Its convenient and can be used to update dataset continuously (by rerunning this command every day).
For example,
mempool-dumpster get 2023-09
would download all sourcelog and transaction data for a month (2023-09). If data for some days is already there it will only download what is missing.
so you can rerun it every day and download the latest files only
I have some questions about the data accuracy for the month of September:
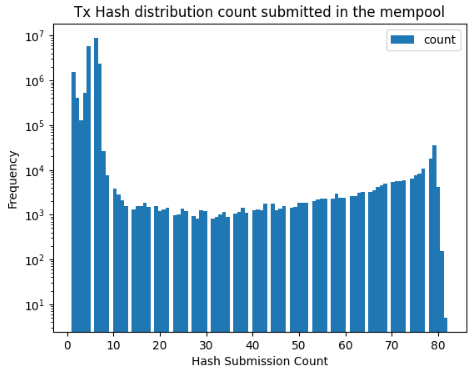
I took all of the sourcelog hash’s that appear more than 10 times and searched that against the transaction-data. There are about 222k unique hash’s that appear more than 10 times. The max count for some of these transactions ranges anywhere from 10-80 in a fairly distributed fashion.
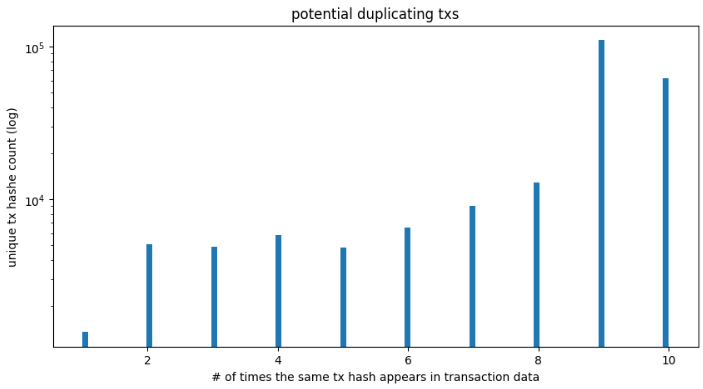
Within the transaction-data files, the max count for duplicate hash’s that appear in the transaction-data tops out at 10.
Some of these transactions have quite a lot of ETH in them. Here is a subset of these transactions. I removed the timestamp column to do this groupby - it seems that the entire row is identical besides the timestamp.
Here is a subset of these questionable transactions:
shape: (222_716, 3)
Several sources resend large amounts of old, pending and already included transactions.
Mempool dumpster only checks inclusion status since a few days, and filters out already included transactions (we’ll backfill this and sanitize the old data in the next couple of days)
Transactions are not validity-checked yet (they could have an invalid nonce, or the sender not enough balance to actually transfer the value)
It does not seem like a bug in the ingestion process, these are transactions that were repeatedly sent by some sources, and might just be no good.
Looking at some of your examples with the highest value:
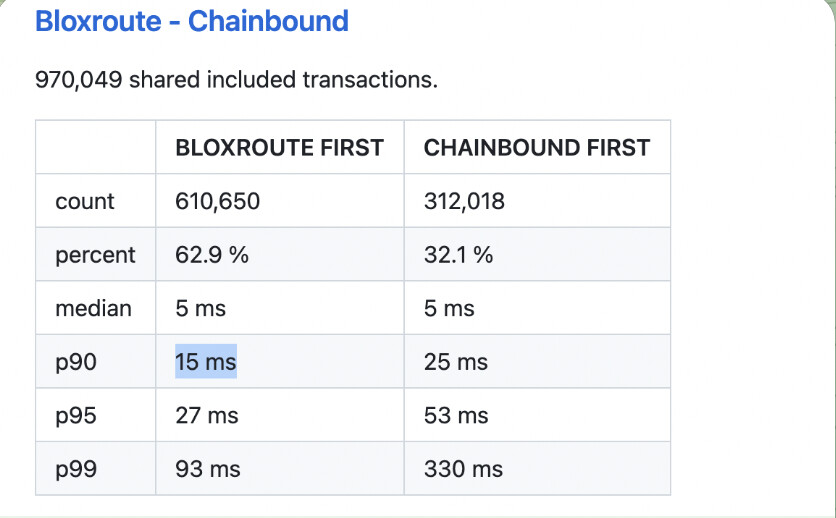
current way of presentation does not provide real value to users.
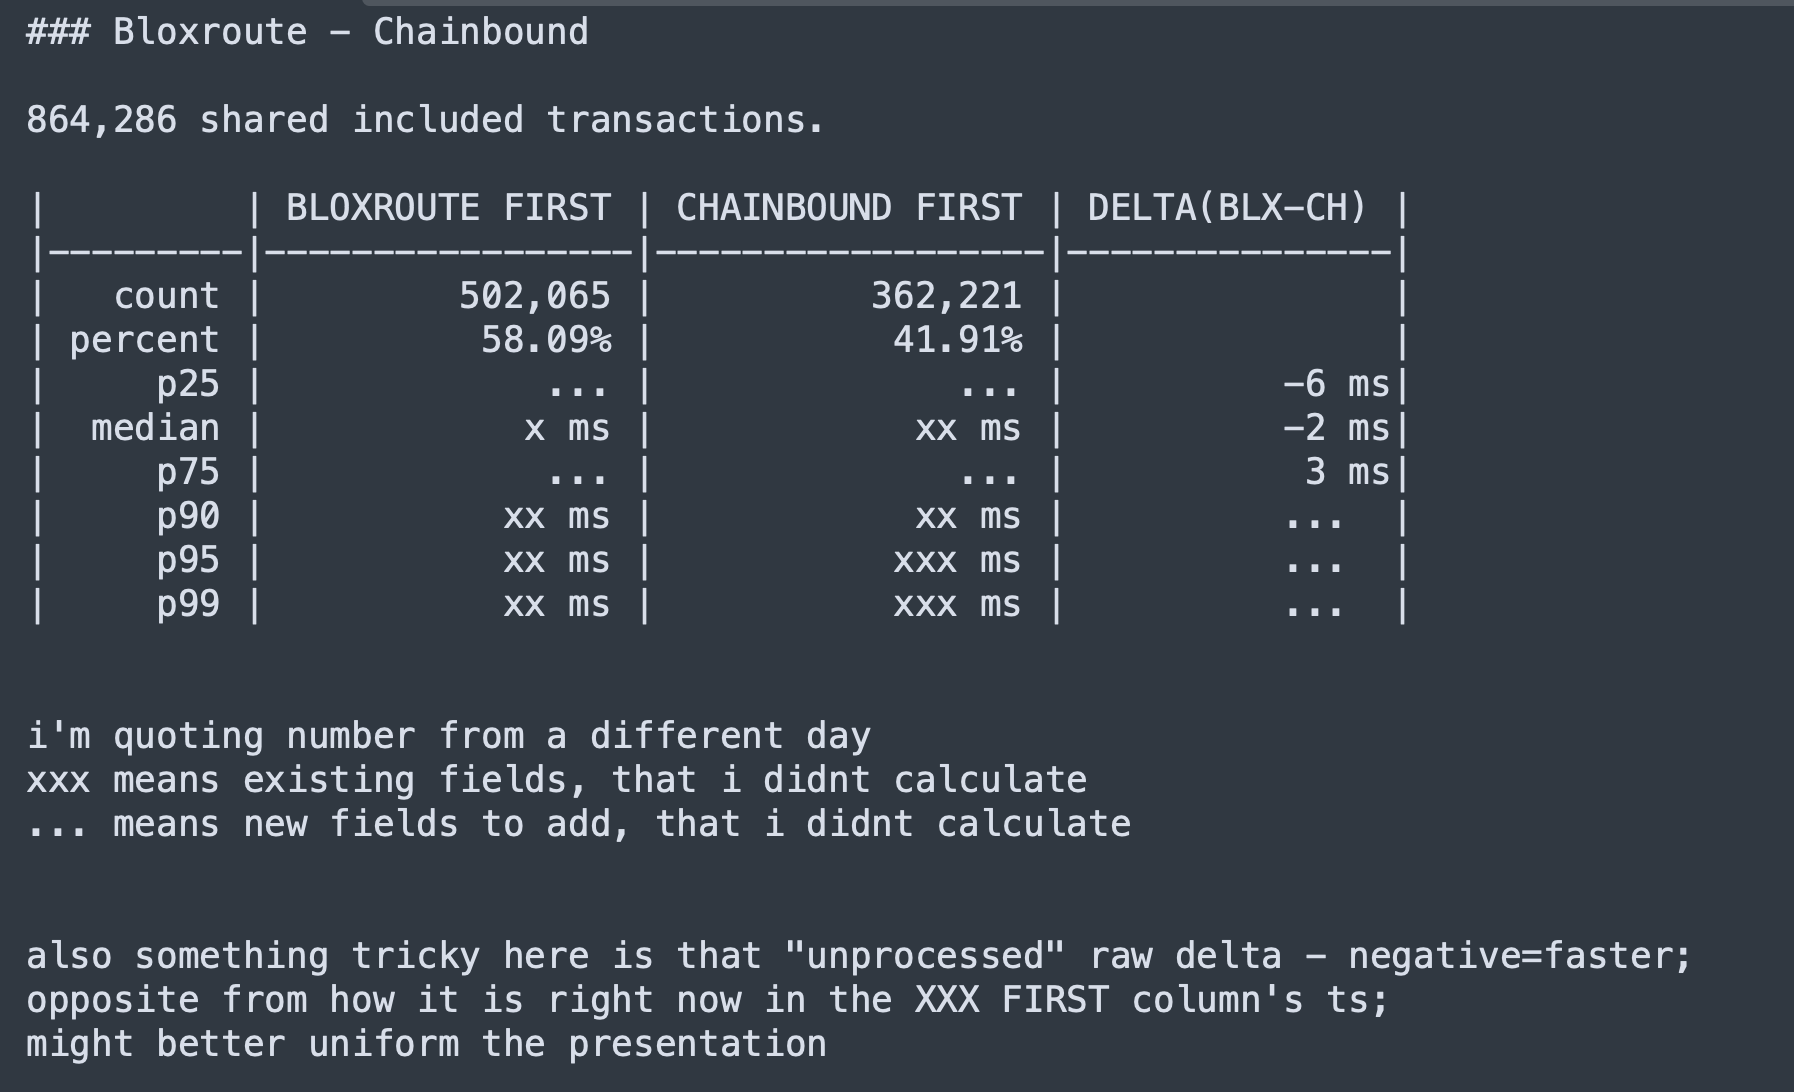
for example, check p99 - it looks like chainbound is much faster on top 1% of the transactions…
but 1% when chainbound first is 3120 txs while 1% when blox first is 6106 tx.
Same for median and the others.
Usually, you do this stats on all results together. So median also tells you how fast/slow the provider is.
With the current format you can’t actually tell which source is faster and by how much.
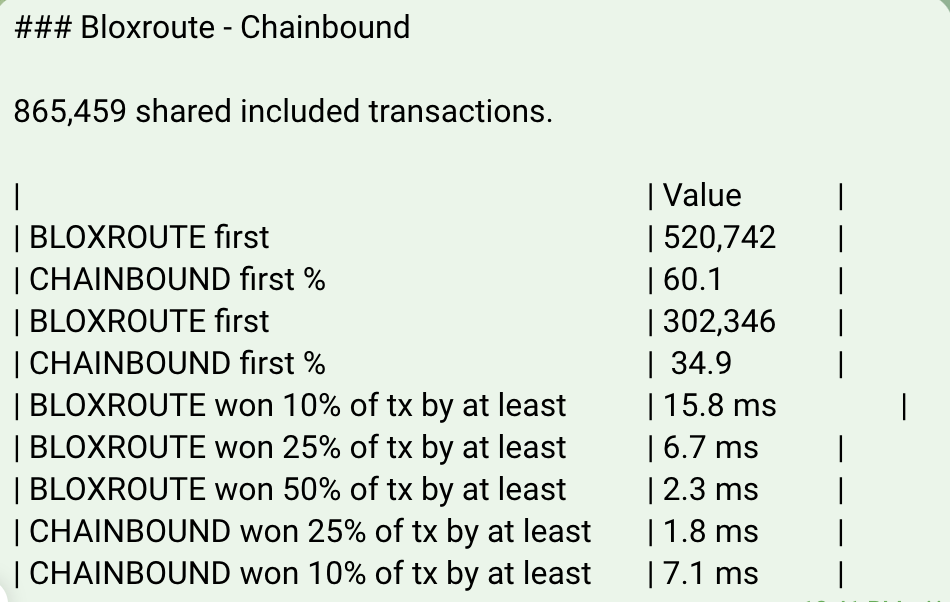
I suggest to change the report so it will look like this:
With the current report (the example above) you calculate seperate statistics for the 2 groups.
in the “bloxroute first” group the median is 5ms and also in the “chainbound first” the median is 5m
but what is teh real median?
It is clear that bloXroute provides first 50% of the transactons, but the time difference is not clear.
What I suggest is to calculate the timediff for each transaction and to take the median, p25, p75, p10 and p90 on that variable,.
Formatting - I leave that to you… The first 4 lines value - you have that already in current report. To calculate the next 5 lines, you create a new variable diff=bloxtime-chainTime.
negative value means that bloXroute was first, positive value means that chainbound was first. Now you sort all these values in ascending order and you check the value in 10%, 25%, 50% (median), 75%, 90%. If the number is negative you write bloxroute won p% of txs by at lease abs(value)' if the number is positive you write chainbound won (100-p)% by at least abs(value)`
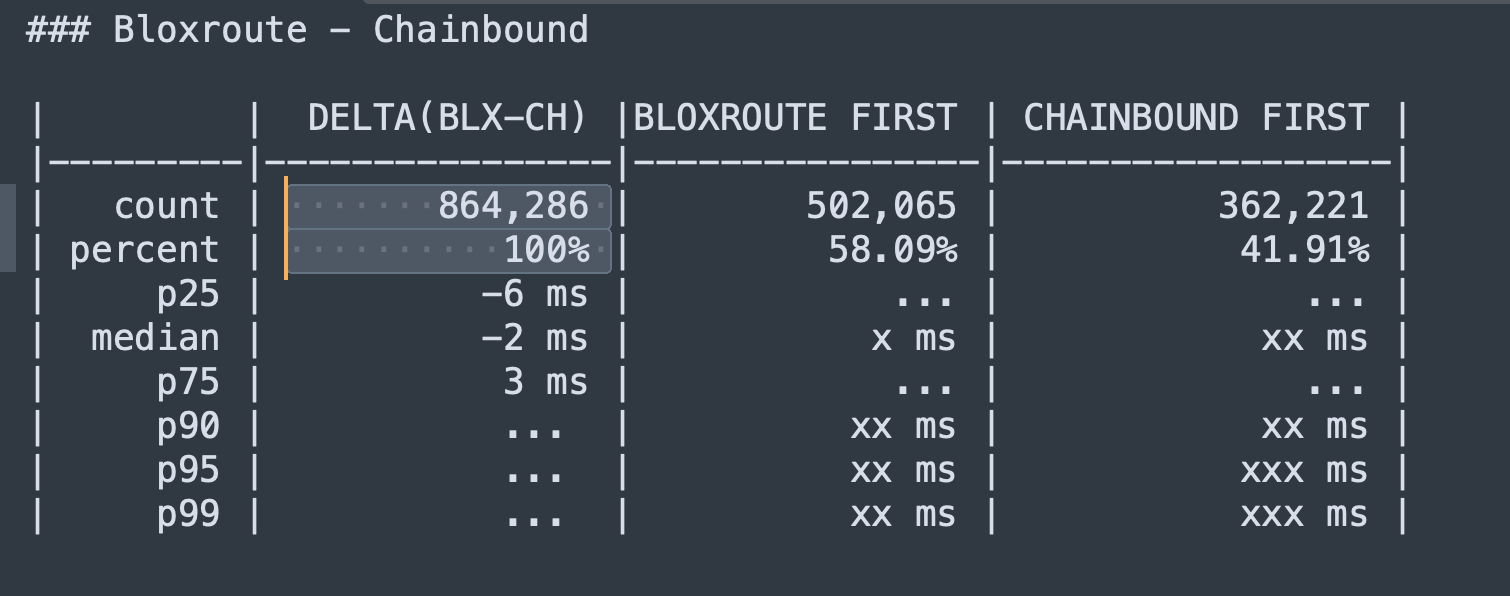
i think the original summary is helpful and pretty clear, to show the stats for the subset of each mempool’s winning tx set 's distribution - so to have an idea about “when X mempool see this % of txs first, how faster do they see it”.
but i think what @offerm suggested also has value to show the stats for the whole shared tx distribution.
it’s like a “bayesian conditional distribution” f(-delta|they_win) vs “global distribution” f(delta) if to make an analogy. And imo both are valuable to show.
I think ideally they meant something like this -
take the whole distribution. for each shared tx hash;
Also i think the way @offerm described in the summary table (e.g. BLOXROUTE won 10% of tx by at least xxx ms) is hard to comprehend / less intuitive for users altho it is strict accurate statistical description, imo prob just listing the stats in a column like above is easier to read.
what are the gasTipCap and ‘gasFeeCap’ columns in transactions-data?
what is the difference between “local” and “mempoolguru” source? Mempoolguru runs 7 full nodes geographically distributed. Mempoolguru also collects from infura. Does this mean that there is overlap between the sources? If so how much overlap?
local vs mempool guru overlap: to find the specific overlap, you can download the dataset and dig into it yourself - Mempool Dumpster ♻️
i briefly did and it looks like there is a non-trivial amount of overlap. Additionally, it looks like mempool guru is being recorded for each mempool guru node local mempool the tx is being sent to so there were a number of transactions being shown as being submitted to mempool guru as 7 (their total number of local nodes).
I didn’t see further motivation to look into the issue more and I don’t think there is anything better that can be done, just wanted to note that this does appear to exist and needs to be taken into account for anyone doing mempool analysis
I’m not quite sure what you mean with “needs to be taken into account for analysis” – could you clarify?
There is a large amount of overlap between the sources, as is expected, and as exists across all sources. The number of mempool guru nodes doesn’t really matter because we have a single subscription where MD receives transactions from.
Here’s a few queries to show the amount of overall transactions for local and mempool guru, and the number of transactions that were seen by both (for 2023-10-17):
$ clickhouse local -q "SELECT COUNT(*) FROM '2023-10-17.parquet' WHERE has(sources, 'mempoolguru');"
948792
$ clickhouse local -q "SELECT COUNT(*) FROM '2023-10-17.parquet' WHERE has(sources, 'local');"
950397
$ clickhouse local -q "SELECT COUNT(*) FROM '2023-10-17.parquet' WHERE hasAll(sources, ['mempoolguru', 'local']);"
938537
First of all, that’s a nifty keyword has from your queries! Secondly, while I agree that we should expect a large overlap between sources, I am questioning the reason for why that is. I think if someone is submitting a transaction to multiple sources, then it makes sense that it is recorded multiple times. However, if multiple sources are just picking up the same tx from the same mempool and then reporting it independently, then I think this is a (slight) issue and at the very least, needs to be filtered out for additional analysis hence my phrase “needs to be taken into account for analysis”.
It appears that you are talking about “local” and “mempool guru” as if they are different sources - at least this is my impression and I will assume this is true, but please correct me if I am wrong here.
The way that “mempool guru” collects data is defined as
"Currently, we collect mempool data from 7 full nodes across the globe (marked on the map below), as well as from RPC services such as Infura and QuickNode. "
The reason why I think it’s wrong to consider the “local” node different from mempool guru is that mempool guru transactions are already geographically distributed. So, for example, if the local node is located in Europe/USA next to one of the mempool guru full nodes, the transactions will practically be identical. However, I can understand the rational to run local nodes that are farther away than the mempool guru nodes and I hope that some thought went into the geographical location for where the local node is being run.
Additionally, my understanding is that you collect mempool txs from Infura and Quicknode separately than mempool guru. Or do you consider the mempool guru txs that come from Infura and Quicknode as the actual txs coming from Infura and Quicknode?
__
The overall issues I am seeing here are that there are multiple mempool transactions being collected from each source, but it’s not necessarily because the tx is being submitted to multiple mempools. Rather it seems to be because each source is just collecting the same tx from the same mempool source. However, if I am misunderstanding something, then please let me know!