Pair trading opportunities as a form of MEV on Ethereum
Motivation
First pioneered by quantitative traders in the 1980s, pair trading is an investment strategy that has gained traction in financial markets. It involves identifying two closely related assets and taking simultaneous long and short positions in them. The essence of pair trading lies in profiting from the relative price movements between the two assets rather than relying on the overall market direction.
The purpose of this study is to perform an analysis of price discrepancies between a pair of assets on decentralized exchanges on top of Ethereum and whether sophisticated MEV searchers can take advantage of such discrepancies. The study aims to identify and quantify the pair trading-based MEV opportunities, analyze how long such price discrepancy can be taken advantage of, how long a position in a price discrepancy must be held, and whether characteristics of pair trading-based MEV opportunities change under increased market distress. The study is limited to analyzing whether pair trading is a viable MEV extraction strategy and does not focus on optimizing different parameters associated with such extraction strategies.
Methodology and Data
I considered a pair of cryptocurrencies to be viable for pair trading if their relationship is stationary based on the Augmented Dickey-Fuller test and mean-reverting based on the Ornstein-Uhlenbeck process. After finding all pairs that fulfill these requirements, I considered pair trading opportunity to be present in a pair if the price relationship of two cryptocurrencies fulfills the following criteria:
and
where S is the exchange rate, f is the fee associated with the trading pair including both pair’s trading fee and gas fee associated with transactions, μ is the long-run mean, and σ is volatility.
If either Equation (1) or (2) does not hold, the price discrepancy is too small for a pair trading opportunity to be profitable. If both Equations (1) and (2) hold but Equation (3) does not hold, this indicates that prices have diverged. The values in Equations (1) and (3) are determined based on values used in TradFi pair trading literature (e.g. Caldeira and Moura 2013; Do and Faff 2010; Gatev et al. 2006; Jacobs and Weber 2015; Riedinger 2017) and Equation (2) is determined as a threshold to filter out price discrepancies that fulfill Equation (1) but would be loss-making after fees.
After identifying all pair trading opportunities, I determined whether different opportunities are profitable or loss-making based on whether they revert or diverge, return of opportunities in terms of percentages, return of opportunities in terms of dollars, entry window of opportunities, and how long positions have to be held.
My data set consists of all transactions in Uniswap v3, Uniswap v2, forks of Uniswap v2, and Balancer trading pairs between September 15, 2022, and September 7, 2023. I filtered the data set to only consist of trading pairs with at least 1 000 transactions during the observation period to only consider actively traded pairs.
Profitability of pair trading opportunities
From identified pair trading opportunities I find the mean return of pair trading opportunities to be positive and the median return to be negative in terms of both percentage and dollars. I calculate the return of opportunities in terms of percentages as the return of a zero-investment position in an opportunity. I calculate the percentwise return of winning pair trading opportunities as \frac{\left|S_{(a,b)} - \mu_{(a,b)}\right| \cdot (1 - f_{(a,b)})^2}{S_{(a,b)}}
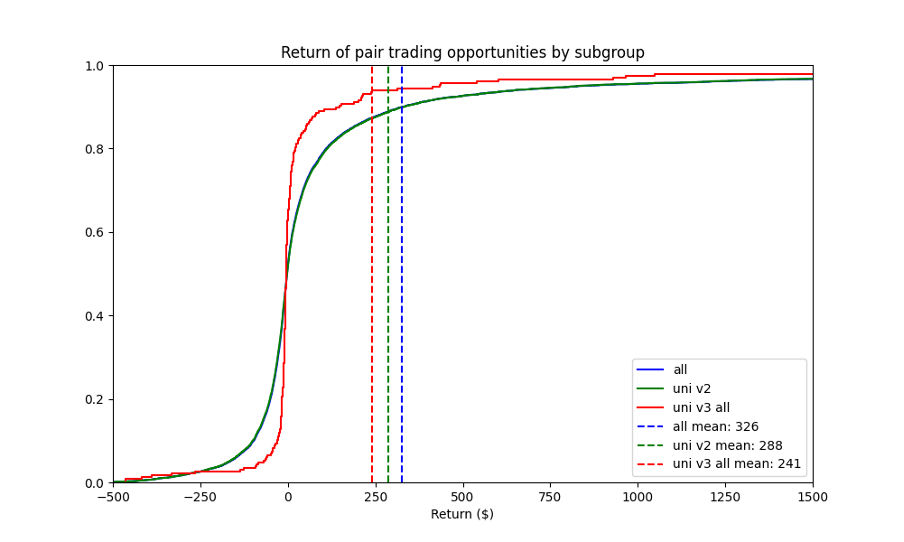
and loss of losing pair trading opportunities as -\frac{\left|S'_{(a,b)} - S_{(a,b)}\right| \cdot (1 + f_{(a,b)})^2}{S_{(a,b)}}, where S'_{(a,b)} is the new exchange rate of the trading pair after the price has diverged. I calculate the return of pair trading opportunity in terms of dollars by calculating the return of an optimally sized position taking into consideration the price impact of entering a position using the following formula for winning pair trading opportunities: \Delta_{a} \cdot \frac{\left|S^{*}_{(a,b)} - \mu_{(a,b)}\right| \cdot (1 - f_{(a,b)})^2}{S_{(a,b)}}, where \Delta_{a} is the change of liquidity in terms of dollars the searcher entering the pair trading opportunity can cause before Equations (1) and (2) no longer hold and S^{*}_{(a,b)} is the average exchange rate paid for the position.
Similarly, I calculate the return of losing pair trading opportunities as -\Delta_{a} \cdot \frac{\left|S'_{(a,b)} - S^{*}_{(a,b)}\right| \cdot (1 + f_{(a,b)})^2}{S_{(a,b)}}
.
The return of opportunities in terms of percentages and dollars is visualized in Figures 1 and 2. The results suggest that pair trading can be used as a profitable MEV extraction strategy over a long period, but individual opportunities tend to make a loss. Uniswap v3 subgroup having negative returns in terms of percentages while having positive returns in terms of dollars implies searchers should optimize the sizing of their positions to profit from opportunities. Out of the 6731 pair trading opportunities, 48% reverted to their long-run mean and, thus were profitable and the remainder diverged and resulted in a loss.
Figure 1: Empirical cumulative distribution function of return of pair trading opportunities in terms of percentages
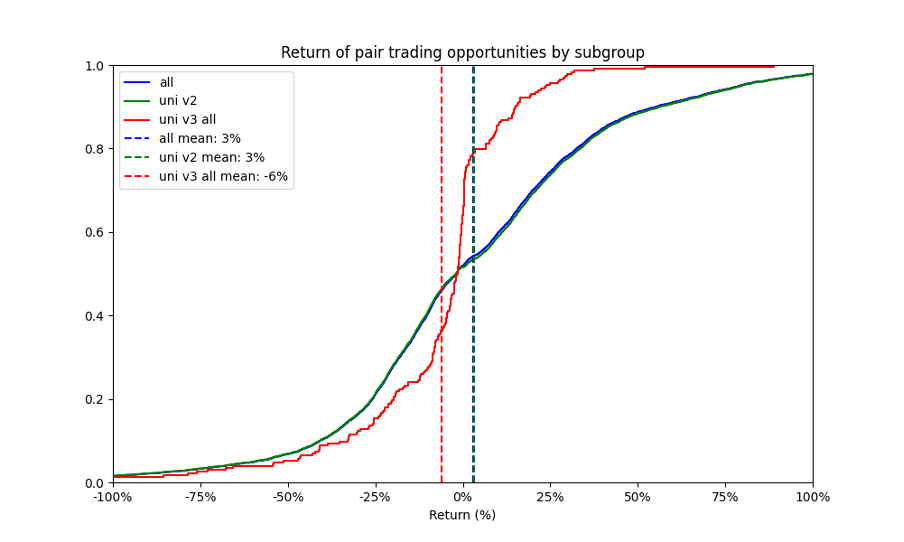
Figure 2: Empirical cumulative distribution function of return of pair trading opportunities in terms of dollars
How long the pair trading opportunities are present?
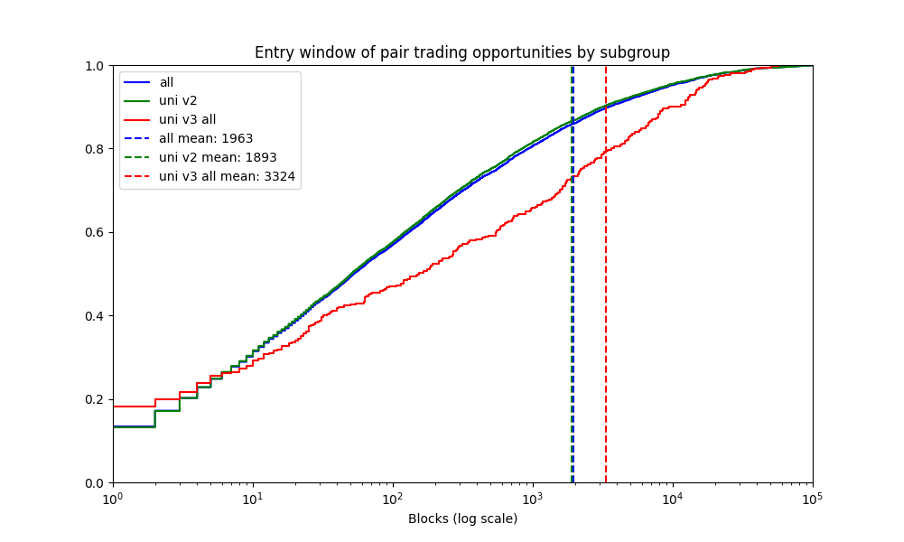
I define a window of entry as how many blocks of pair trading opportunities are present. Pair trading opportunities have a median window of entry of 53 blocks and a mean of 1963 blocks. The distribution of how long the entry window lasts is heavily positively skewed as suggested by the median and the mean and as visualized in Figure 3.
The median of 53 blocks suggests that pair trading is not as time sensitive as MEV extraction strategies related to atomic arbitrage or liquidations. A rational searcher will take advantage of such an opportunity if they expect price discrepancy to revert and expect risk-adjusted returns of such an opportunity to be high enough. Such opportunities can be present for long periods without rational searchers taking advantage of them for various reasons. For example, the left side of Equation (2) is only slightly above the right side of the inequation meaning the potential for monetary gain is small if the price reverts in the future. This results in the risk relative to the potential returns of such an opportunity being high. Alternatively, a searcher might be willing to take advantage of such an opportunity but lacks the funds in the correct cryptocurrencies to benefit from the opportunity, or taking advantage of such an opportunity would decrease or increase searcher’s inventory in certain cryptocurrency to a level that increases searcher’s overall risk too high considering all MEV extraction methods the searcher uses.
Figure 3: Empirical cumulative distribution function of entry window of pair trading opportunities
Holding period
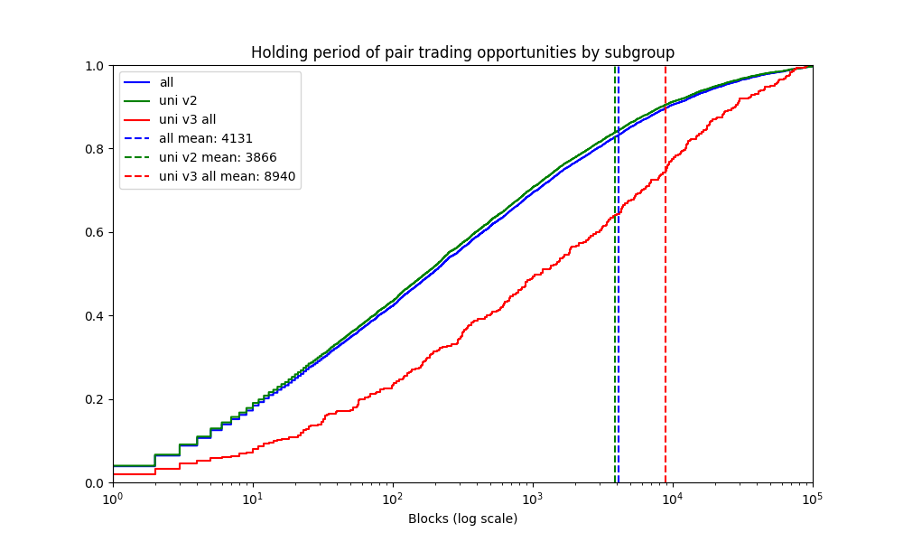
Pair trading opportunities are not atomic like other MEV opportunities such as arbitrage or liquidations, but instead require a position to be held for a certain length of time until the price discrepancy either reverts or diverges. The pair trading positions have a median holding period of 190 blocks and a mean of 4131 blocks. The distribution of the holding period is heavily positively skewed as suggested by the median and the mean and as visualized in Figure 4.
Figure 4: Empirical cumulative distribution function of holding period of pair trading positions
Correlation
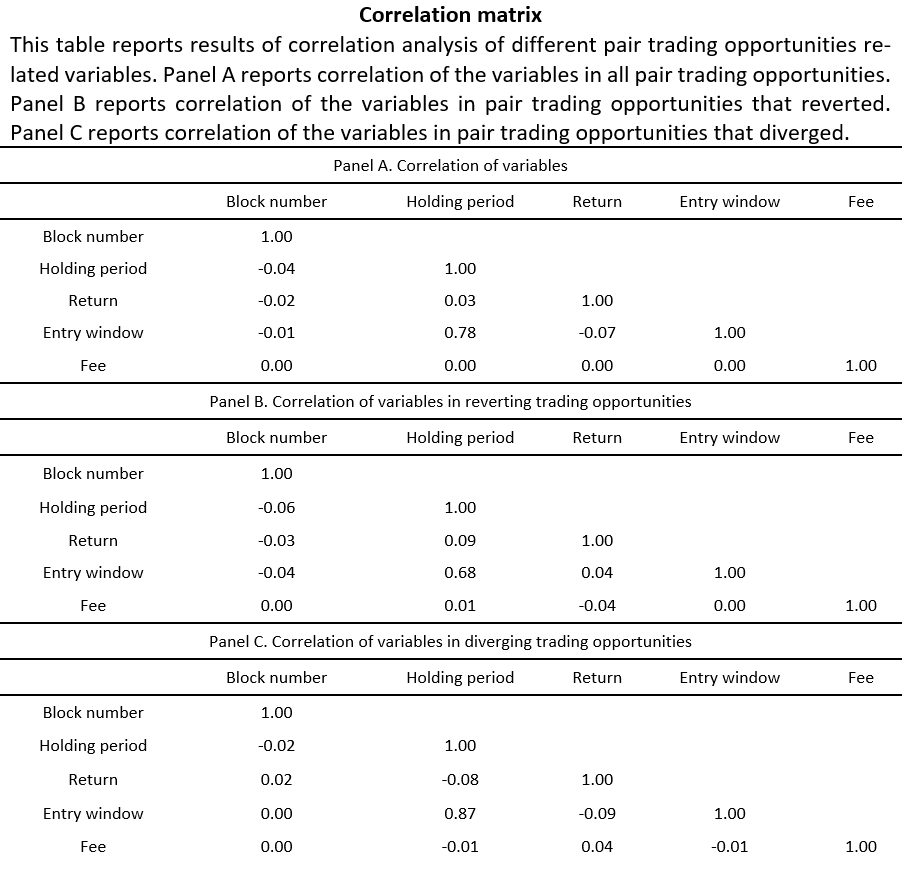
Block number, return, entry window, holding period, and fees are not correlated with one another, excluding the holding period and entry window which have a 0.78 correlation coefficient for all pair trading opportunities, 0.68 correlation coefficient for reverting opportunities, and 0.87 correlation coefficient for diverging opportunities. The strong correlation between holding periods and entry windows can be partly explained by the definition of holding periods and entry windows. The correlations of variables are listed in Table 1.
Block number does not have a strong correlation with any of the variables. This suggests that there is no clear trend of different variables developing over the observation period. The return of the opportunities does not have a strong correlation with other variables suggesting that opportunities with longer holding periods and entry windows should not be expected to have different returns than opportunities with short holding periods and entry windows.
Table 1: Correlation of different variables
Pair trading during increased market distress
Observing how returns, entry windows, and holding periods changed during the collapse of FTX, the bankruptcy of Silicon Valley Bank, and the exploitation of Curve finance pools I conclude that changes in variables are unambiguous and do not support an argument of MEV searchers behaving differently during increased market distress.
The median return of pair trading opportunities decreased in two of the three samples with increased market distress. The holding period was longer in two of the three samples and shorter in one sample. The entry window was longer in one sample, was shorter in one sample, and did not change in one sample. A decrease in median returns combined with an increase in the holding period could suggest taking part in a pair trading strategy is less appealing during periods of increased market distress. However, further research should be conducted on the topic.
Implications
The findings of this research suggest that MEV searchers can use a pair trading strategy as a profitable MEV extraction strategy over a longer period as the mean of returns is positive. However, a negative median of opportunities suggests that individual opportunities tend to make a loss. Furthermore, the Uniswap v3 subgroup having a negative mean return in terms of percentages and positive in terms of dollars suggests sizing of positions plays a crucial part in searchers profiting from pair trading opportunities. Further research should be conducted to analyze what drives the returns of this strategy and whether losing opportunities could be filtered out.
The majority of the opportunities are relatively time sensitive with the median entry window for positions lasting for slightly above 10 minutes the median entry window for reverting positions lasting for 7 minutes and 14 minutes for diverging positions. Further research should be conducted to analyze if there are differing underlying characteristics that can explain why certain opportunities are more time sensitive than others and whether there is an efficient way to filter out diverging positions.
The majority of opportunities take 38 minutes to either revert or diverge with reverting positions taking the median of 60 minutes to revert and diverging positions taking the median of 25 minutes to diverge. Further research should be conducted to analyze if there are differing underlying characteristics that can explain why certain opportunities take longer to revert or diverge than others and whether there is an efficient way to filter out diverging positions.
The findings do not have unambiguous evidence of pair trading opportunities’ characteristics changing under increased market distress. Future research could expand on this study’s results when analyzing MEV searchers’ behavior in a more comprehensive study. Future research could also analyze the risk and return profile of other statistical arbitrage opportunities compared to pair trading.
Besides unambiguous evidence of pair trading opportunities’ characteristics changing under increased market distress, there is no evidence of competition among MEV searchers changing, when it comes to pair trading, during the observation period. There is no correlation between block number and return, entry window length, or holding period of position of the data set suggesting that there is no trend in these variables during the observation period. This suggests that an argument that the competition among MEV searchers has increased over the observation period cannot be supported by these pieces of information. This might be caused by pair trading opportunities having unappealing risk-adjusted returns.
Limitations
To my knowledge currently, there is no public data set quantifying statistical arbitrage-based MEV opportunities. The lack of such data limits my ability to draw extensive conclusions about statistical arbitrage-based MEV. Pair trading is only a single statistical arbitrage technique, and one should be careful when generalizing based on such results.
I analyze whether MEV searchers have changed their behavior related to pair trading based on variables related to pair trading. Such analysis is narrow and could be improved, for example, by considering how the available extractable value from pair trading-based MEV opportunities has changed relative to the extracted amount of atomic arbitrage MEV or more sophisticated statistical arbitrage-based extraction models. Such analysis is also unable to capture the actual magnitude of behavior change as it only focuses on a subset of techniques indicating the behavior change.
Future research directions
While this study has provided valuable insights into the potential of pair trading as a means of capturing MEV on Ethereum, there are several intriguing avenues for further exploration and research. The following are potential future research directions that can deepen understanding of sophisticated MEV extraction methods and their impact on the blockchain industry.
I have analyzed pair trading opportunities based on MEV on top of Ethereum. The research could be replicated on top of other blockchains. This would give a better understanding of MEV under different blockchain microstructures and could potentially help in designing better blockchains in the future.
I have only focused on pair trading opportunities. Future research could study other statistical arbitrage strategies such as CeFi-DeFi arbitrage as a form of MEV. This would help to give a clearer picture of more sophisticated MEV extraction methods and the behavior of MEV searchers over time and under different market regimes. Future research could also analyze risk and return profiles between pair trading opportunities and other MEV extraction strategies. Other MEV extraction strategies might be a lot more appealing to the MEV searchers.
I perform an analysis of price discrepancies and reversion. Future research could build upon this to optimize different parameters to reduce the number and percentage of diverging pair trading positions. Future research could also expand on other relevant questions that are outside of this study’s scope such as inventory and risk management strategies the searchers taking part in pair trading and other forms of statistical arbitrage-based MEV should use. Future research could also analyze optimal exit points for pair trading positions to define what amount of reversion is optimal for take profit and what kind of stop loss the searchers should use.
The underlying characteristics causing the profitability of the pair trading strategy could be researched further to gain a better understanding of why the pair trading strategy is profitable and why certain price discrepancies last longer than others. Future research could, for example, consider whether the profitability of the pair trading strategy is caused by positions that carry high risk.
Future research could combine analysis of pair trading with analysis of atomic arbitrage opportunities MEV searchers take advantage of and trading activity. Combining these analyses could help in understanding whether MEV searchers change their behavior under increased market distress.
References
- Caldeira, J. & Moura, G. (2013). Selection of a Portfolio of Pairs Based on Cointegration: A Statistical Arbitrage Strategy.
- Do, B. & Faff, R. (2010). Does Simple Pairs Trading Still Work? Financial Analysts Journal, 66(4), 83–95.
- Gatev, E., Goetzmann, N. & Rouwenhorst, G. (2006). Pairs Trading: Performance of a Relative-Value Arbitrage Rule. The Review of Financial Studies, 19(3), 797–827.
- Jacobs, H. & Weber, M. (2015). On the Determinants of Pairs Trading Profitability. Journal of Financial Markets, 23(1), 75-97.
- Riedinger, S. (2017). Demystifying Pairs Trading: The Role of Volatility and Correlation.