Hi. Cool contribution; I love to see more people looking at MEV data. I have a few questions:
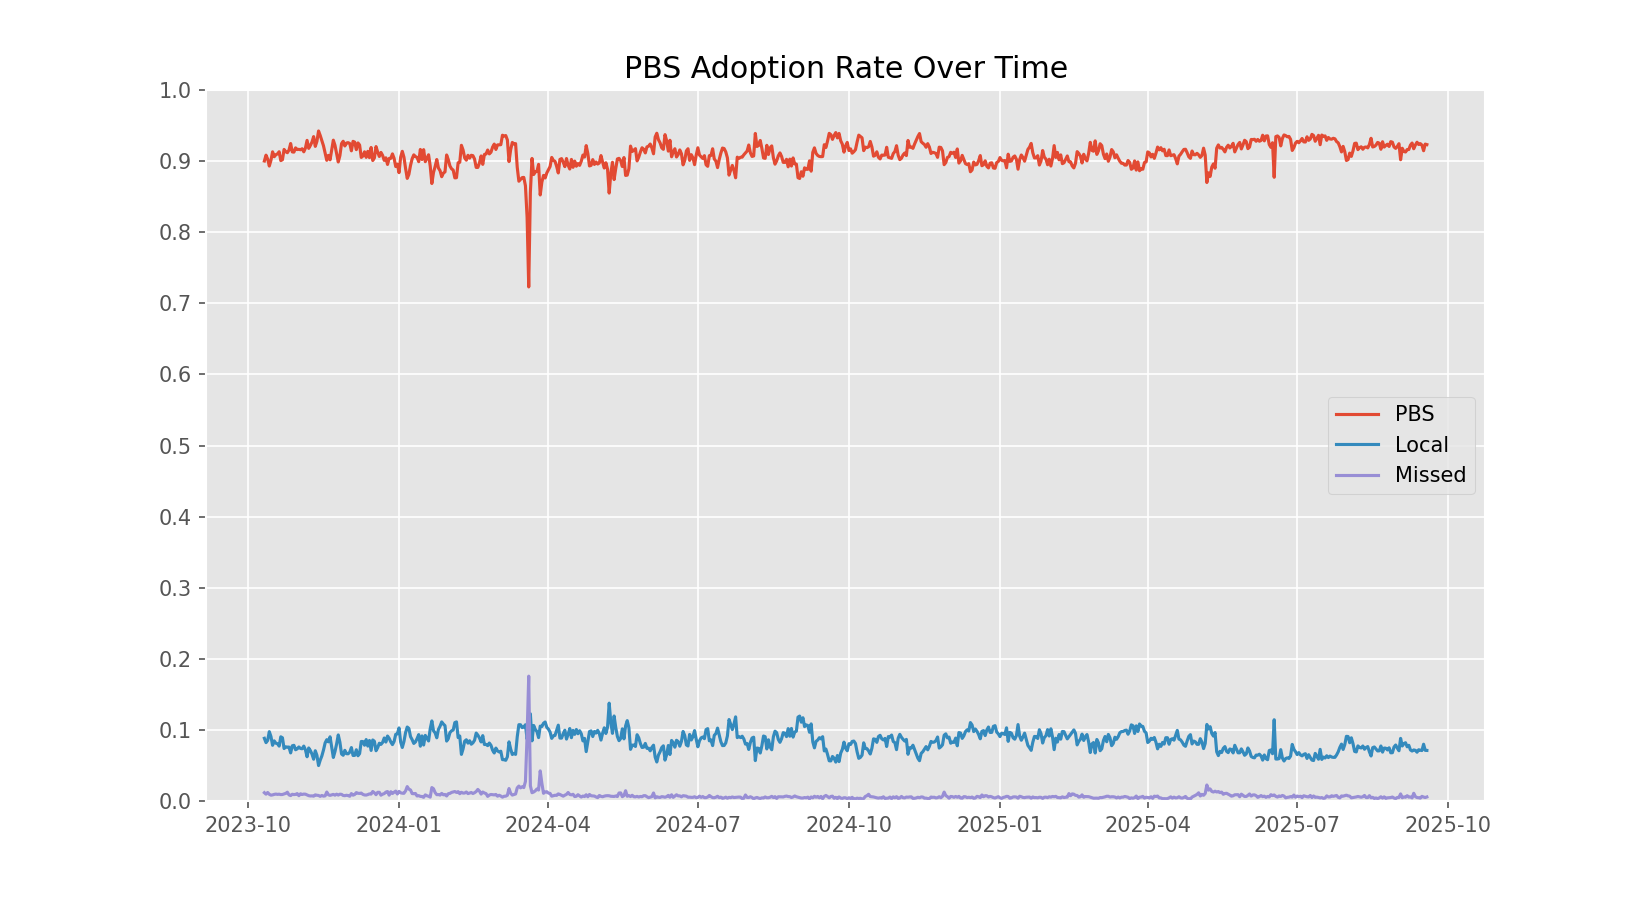
How did you derive your PBS adoption rates? If I do something like this, I get much more consistent adoption around 90%. With the drops usually coming from bigger outages in the network.
base_path = './data/'
file_paths = os.listdir(base_path)

dfs = []
for file in file_paths:
    df_tmp = pd.read_parquet(os.path.join(base_path, file))
    dfs.append(df_tmp)

df = pd.concat(dfs)
df.drop_duplicates(subset='block_number', inplace = True)

def resample_data(data, origin=pd.to_datetime('2022-09-14'), step_size = '1D'):
    tmp = data.set_index('block_datetime', drop=True)
    return tmp.resample(step_size, origin=origin).count()['slot']

pbs = resample_data(df[~df['relay'].isna()])
local = resample_data(df[df['relay'].isna()])
missed = 7200 - resample_data(df)

plt.plot(pbs/7200, label = 'PBS')
plt.plot(local/7200, label = 'Local')
plt.plot(missed/7200, label = 'Missed')
plt.gca().set_yticks(np.arange(0, 1.01, 0.1))
plt.ylim(0, 1)
plt.legend()
plt.show()
I think you might be confused about the bid_timestamp_ms column in the dataset. That column is not normalized for when the slot happens; so those average values represent milliseconds since January 1, 1970 (aka the Unix epoch). In effect, the average calculation you’re presenting is the average datetime of blocks from each relay. Without normalizing for the time of the slot, this is not a performance metric. The reason that ETHGAS and BTCS data is an outlier compared to the others is that the relays are newer, so the average does not contain blocks from many years back.
I’m not sure where you’re getting this 0.01 ETH metric for min-bid reversions. When a proposer uses min-bid those blocks will not have an associated value_eth column in the dataset → since locally built blocks do not get delivered by PBS relays. In order to analyze this class of blocks requires one to either merge this dataset with other onchain data or to look at where the dataset is missing data. Something akin to this essay, but ideally more robust since it fails to capture some of the nuance (e.g., proposer sets that use min-bid for only a subset of their blocks).
You can find example code for that in the same github repository as the data source.
Cool find with identifying that super lucky proposer. A small note, there are duplicates in the dataset when blocks are delivered by multiple relays, so they did not actually deliver 121 blocks but have still proposed 50! You can see a history of all of them here:
https://beaconcha.in/validator/1922844#blocks
I don’t understand your Proposer PBS Rate Distribution represents. As mentioned earlier, the 0.01 metric is not indicative of the block being locally built–if a block value is present in the dataset at all, then it is a PBS block.