i was inspired by @Data_Always idea on ‘why are blocks built locally?’ I tried my best to answer that, as I’m still wrapping my head around it. did some data analysis too and hope the research helps.
my research analysis doesn’t fully solve it yet (since we’d need per-proposer latency patterns and explicit getHeader() traces), but it narrows the causes down to
-
(i) proposer-specific latency,
-
(ii) min-bid reversion, and
-
(iii) deregistration behavior,
all things that tie directly into inclusion-list design and ePBS planning.
let’s get in..
tl;dr
even though 98%+ of ethereum proposers are registered with relays, only 93.01% of blocks are built with proposer–builder separation (pbs). the remaining 6.99% of blocks, over 619k out of 8.86m I analyzed; are locally built. digging into relay latency, builder concentration, and proposer behavior, I find that relay performance is not the bottleneck. instead, min-bid reversions on low-mev blocks (307,615 cases) and a long tail of misconfigured or selectively opting-out proposers (5,003 below 50% pbs rate) explain the persistence of non-pbs blocks.
this analysis assumes you know how mev-boost works, what pbs means, and why proposer incentives matter.
data source
- MEV block value data from dataalways/mevboost-data on GitHub - grateful to @Data_Always for this !!
a little deep dive into pbs
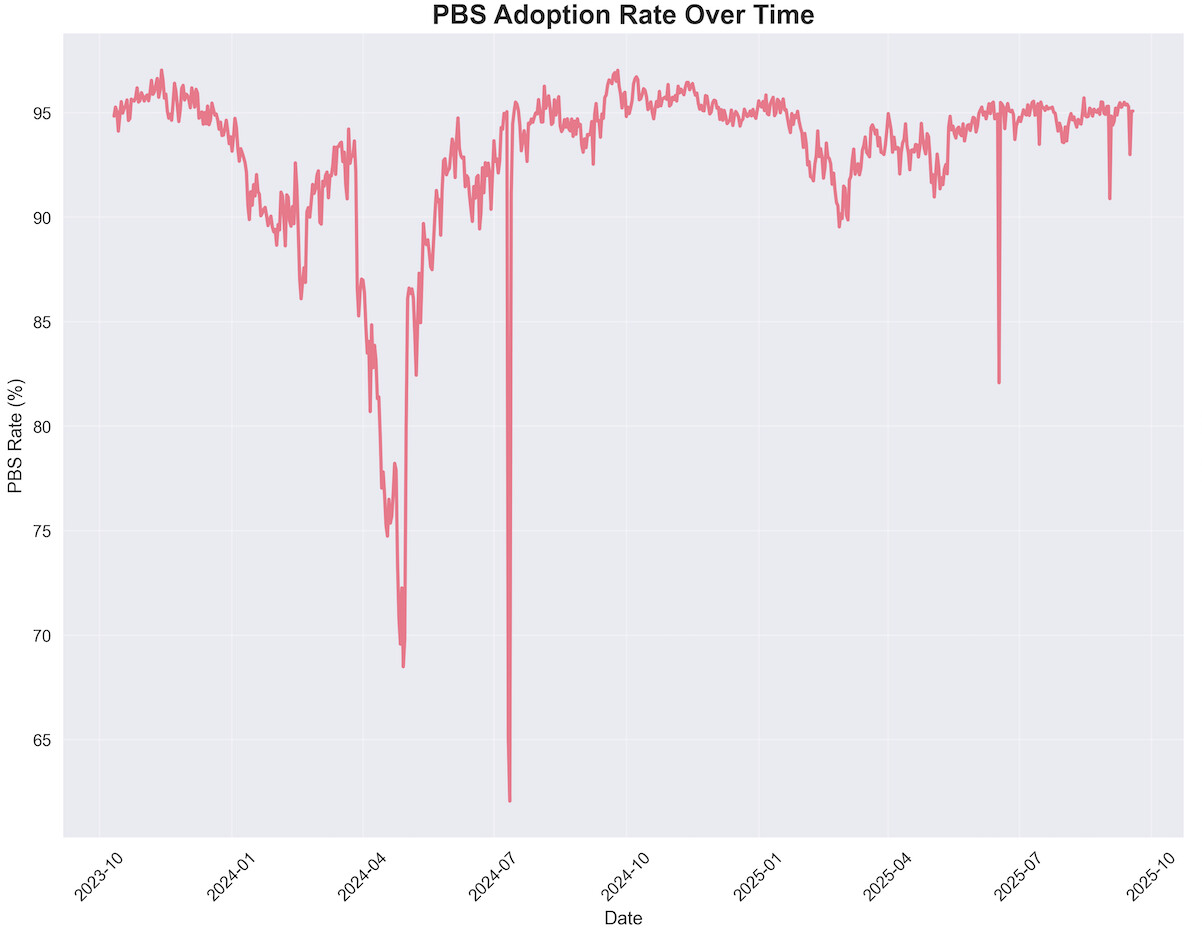
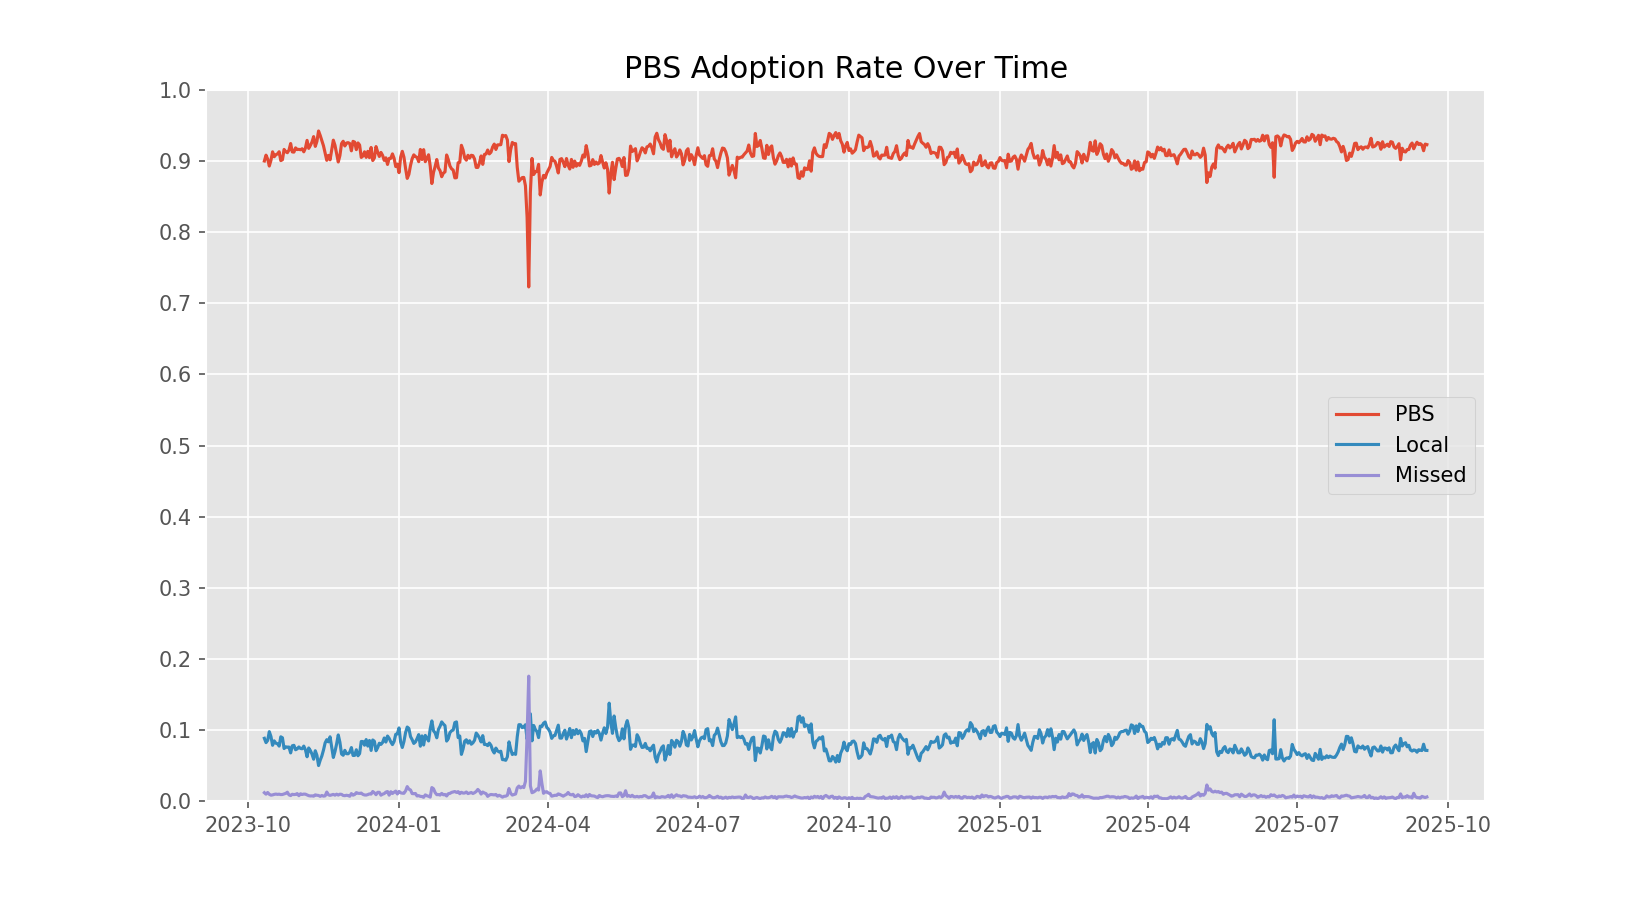
pbs was introduced to outsource block construction to competitive builders via relays, increasing efficiency and mitigating mev centralization. on paper, relay registration exceeds 98%, suggesting near-universal adoption. however, the dataset i used shows 93.01% actual adoption, meaning almost 7% of blocks (~619,000 out of 8,866,711) were still locally built during the observed period. the question is whether these non-pbs blocks result from relay failure, builder unavailability, or proposer-side choices.
relay performance is another key factor as they are the bridge between block builders and validators in as such they are responsible for storing blocks till they get signed and prposed. this led me to delve more into what relay performance looks like and the next section uncovers that.
relay performance
my analysis of relay performance shows that its latency footprints shows no signs of systemic failures. no relay averages exceed 8 seconds in bid time, and no blocks take longer than 12 seconds from bid to slot. ethgas consistently performs well, with an average offset of -1,754,629,353,913 ms (negative values reflect the logging method; the key point is consistency).
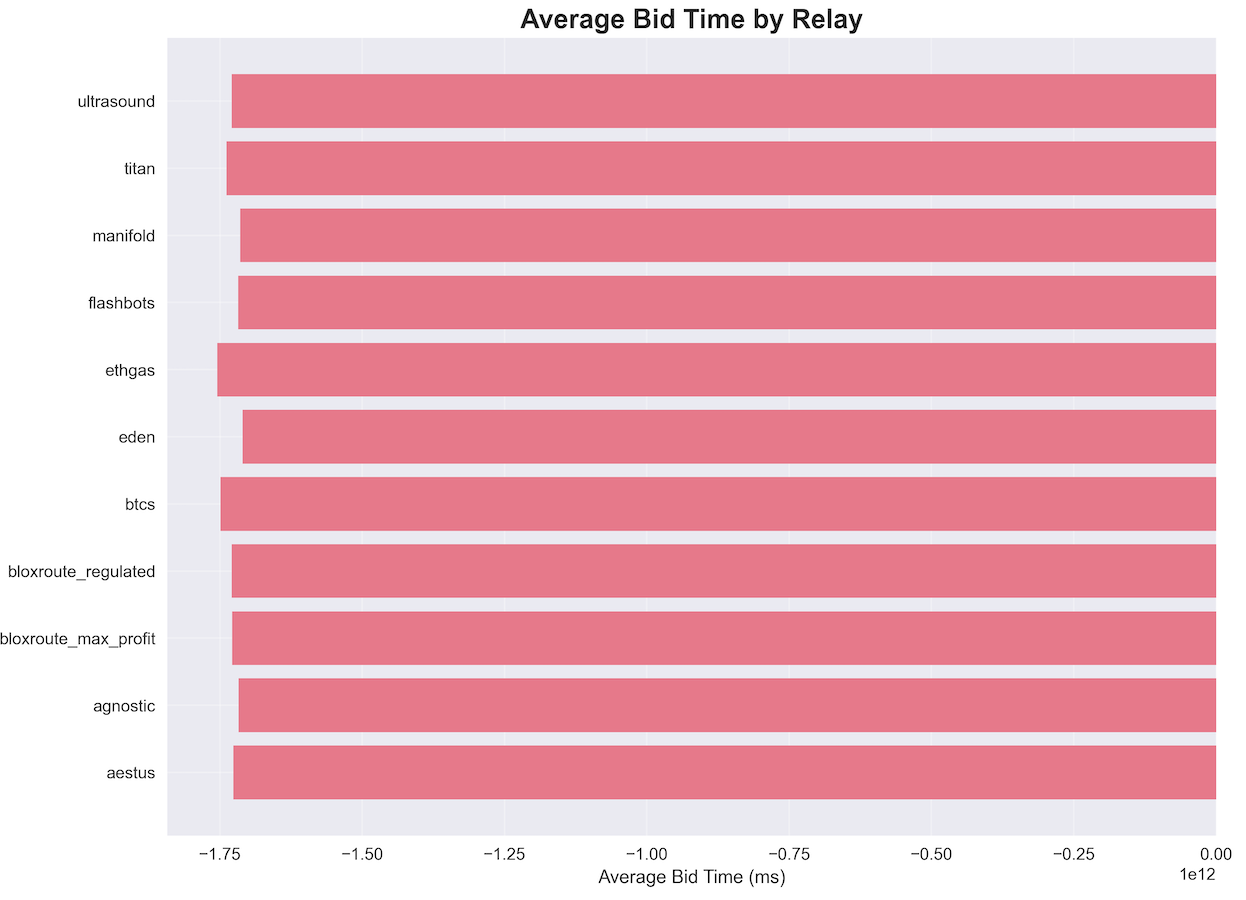
looking at the data, i took it a step further and checked from a geographical angle, seeing if regional footprints (us/eu) for ultrasound show consistent coverage. this helps rule out location as a main factor for non-pbs blocks. overall, relays deliver blocks reliably, so non-pbs blocks aren’t just an artifact of relay behavior.
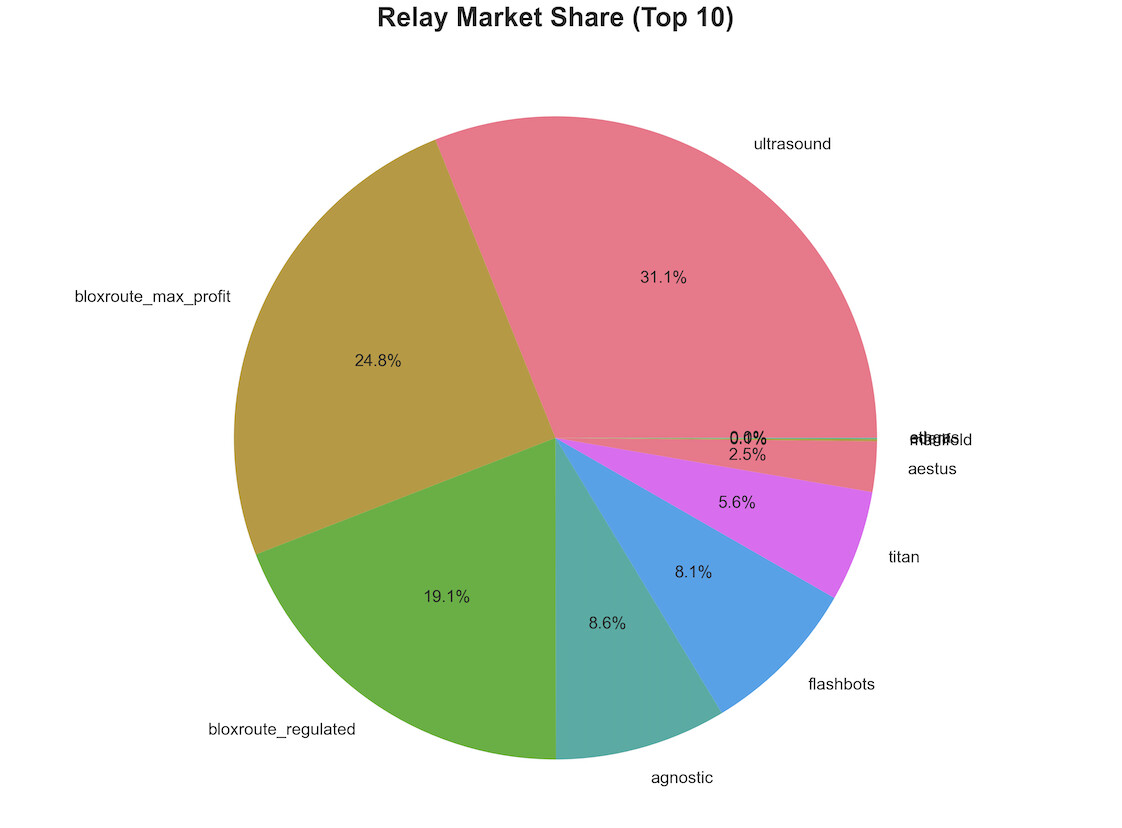
i got this data in terms of the relay market share too.
up next, the builders…
the builders
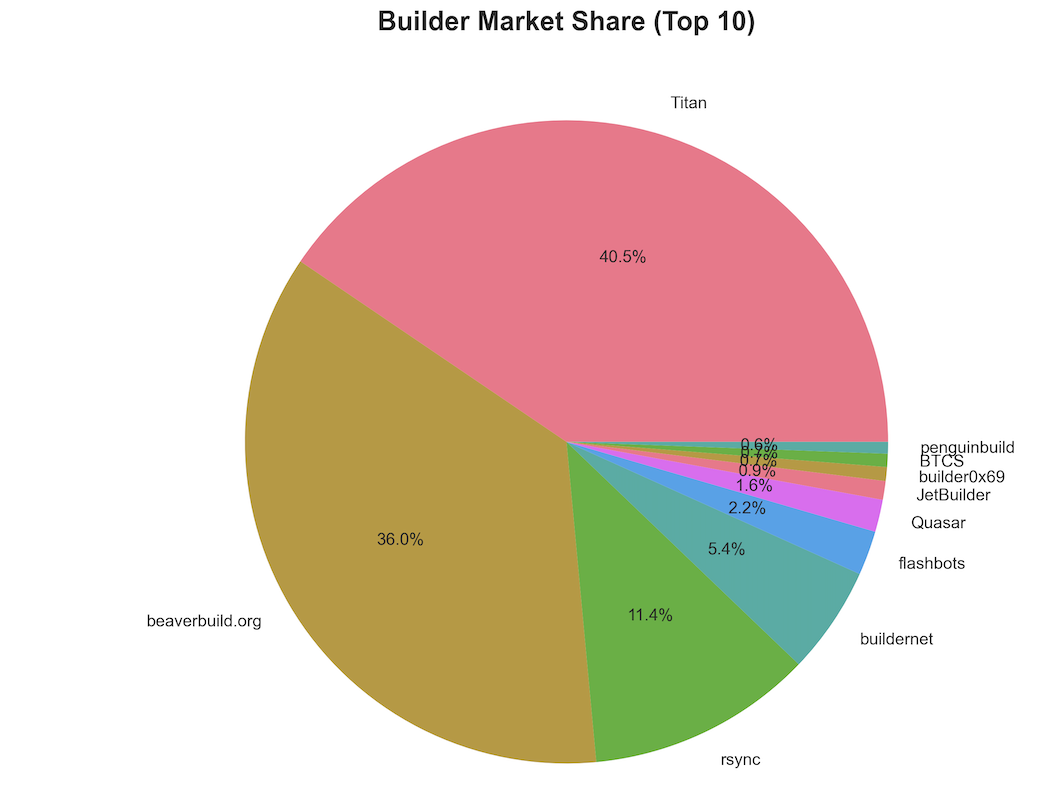
i was able to find out from my data that pbs blocks are heavily dominated by the top five builders, who collectively control 93.3% of all pbs blocks. this concentration ensures that high-value bids are almost always available, making builder unavailability an unlikely explanation for non-pbs blocks.
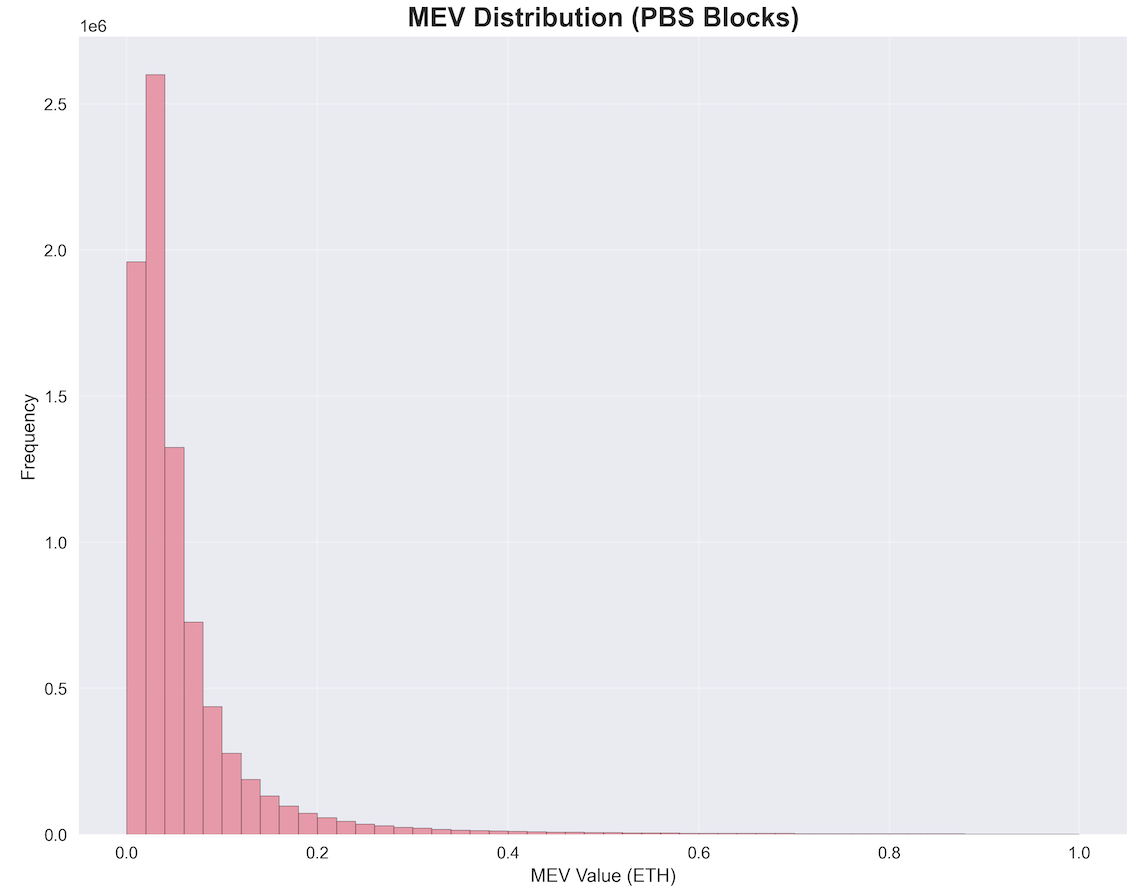
i was also able to uncover that there are 307,615 blocks with less than 0.01 eth mev, which likely represent potential min-bid reversions.
onto proposers..
the final lap - proposers
this was where i saw it all and made left me suprised as it shows the clearest signal on proposers behaviour. on average, pbs adoption per proposer is very high at 97.96%, but 5,003 proposers exhibit less than 50% adoption, accounting for a substantial fraction of local block building. the most active proposer; 0xa945e7c695540e383823661a59c06f4ec0642af7b37016cddb768e68723034e595ae5cef005cf17f0972f436fcc59d51 (121 blocks)
hold your cups, the most shocking was the 307,615 blocks with <0.01 eth mev — a footprint of min-bid thresholds where proposers reject low-value bids and fall back to local block building. this shows that the thresholds are strongest among smaller or independent proposers, while large staking entities align more closely to full pbs adoption.
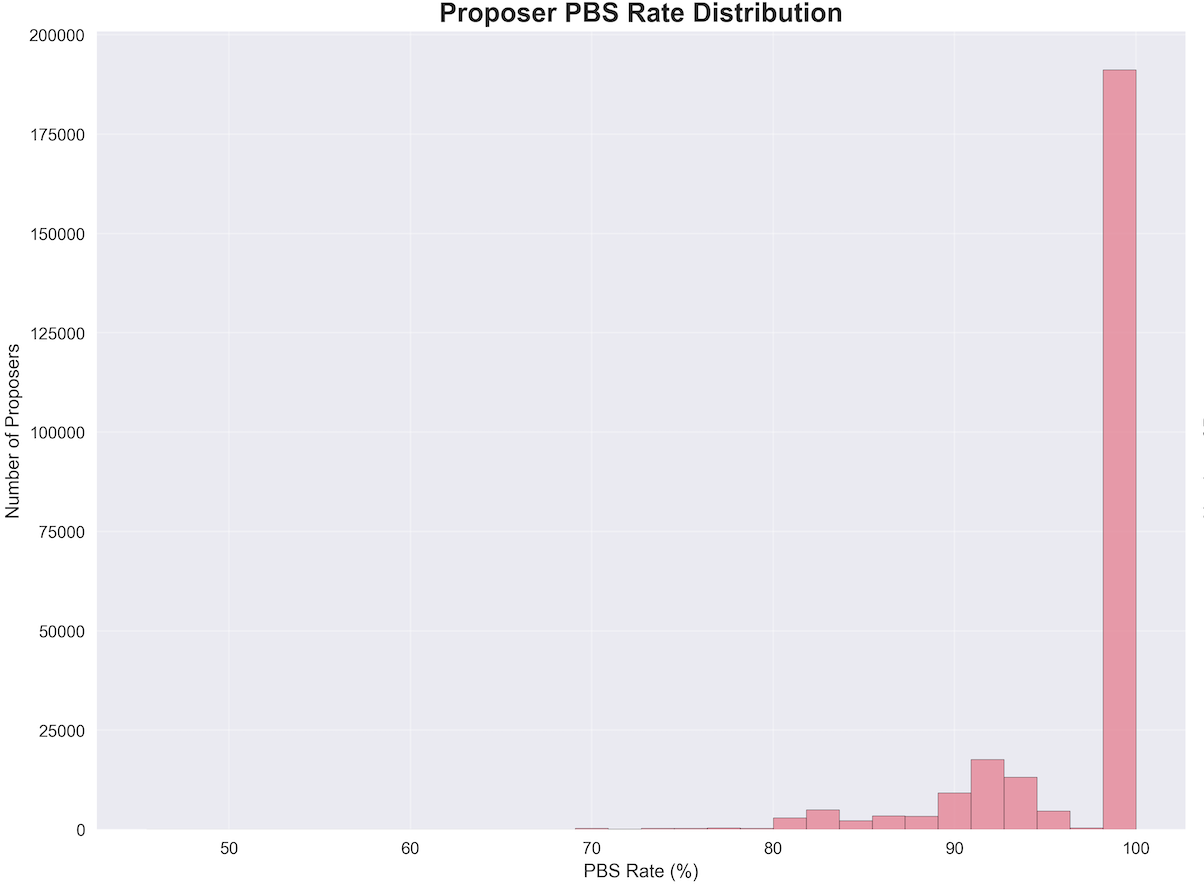
overall, proposer behavior strongly influences the occurrence of non-pbs blocks, with low-value bids and smaller proposers driving much of the local building activity.
the curtains begin to close, my theoretical impact
all this data points to my theoretical impact. breaking down the 6.99% non-pbs share:
-
~3–4% from min-bid reversions on low-value blocks (<0.01 eth mev),
-
~2–3% from misconfigured or selective proposers (5,003 sub-50% accounts), and
-
~1% from indeterminate factors like validator quirks, fallback policies, or manual local building.
overall, this triangulates non-pbs blocks as mostly proposer-driven rather than relay or builder-driven.
that’s it
all thanks to @Data_Always for providing the data, just helping and contributing my part.
some open questions i came up with are;
-
how much value are proposers giving up on min-bid reverts? is rejecting sub-0.01 eth bids rational relative to consistency?
-
are regional relay latencies correlated with proposer-specific fallback behavior in edge cases?
and finally i think with relays performing consistently, closing the adoption gap relies on better defaults, proposer education, and alignment, rather than additional relay optimization.
Crypto is Elegant.