Oriol Saguillo, Carlos Fiestas, Nethermind MEV Starknet Research have collaborated in this research
The topic of Layer-2 Maximal Extractable Value (MEV) has emerged as a focal point of discourse in recent years, owing to its implications for scalability within the Ethereum ecosystem and the potential for increased value extraction. Presently, the landscape of Layer-2 solutions encompasses two primary types: Optimistic Rollups and ZK Rollups. In the majority of these architectures, the sequencer currently operates as a centralized entity, pending technological advancements that may facilitate decentralization. Consequently, examining both the existing and prospective MEV is crucial for understanding and ensuring the future prosperity of these layer-2 blockchain.
Recently, Starknet MEV has garnered interest due to its untapped potential and competitive edge. What opportunities, then, can potential searchers explore on Starknet? Numerous articles provide insight into established strategies like atomic arbitrage between decentralized exchanges (DEXs), deployment of liquidation bots, and central exchange CEX to DEX arbitrage. Presently, CEX-DEX arbitrage offers the most lucrative opportunities, largely due to price discrepancies between real-time order books on certain exchanges and on-chain automated market makers (AMMs).
The research paper Layer-2 Arbitrage: An empirical Analysis of Swap Dynamics and Price Disparities on Rollups by Krzysztof Gogol et. al. was recognized as the best paper at the MARBLE conference. This paper introduces the Maximal Arbitrage Value (MAV) metric, a novel tool designed to quantify arbitrage opportunities between an Automated Market Maker (AMM) and a Centralized Exchange (CEX).
In this paper, we examine methods for quantifying arbitrage opportunities between Centralized Exchanges (CEXs) and Decentralized Exchanges (DEXs) within the Starknet Blockchain framework. Our investigative approach is an extension of previous techniques utilized in the context of Optimistic Rollups, as delineated in the scholarly work of Krzysztof Gogol et al. Furthermore, this study will ascertain whether the top three identified opportunities are exploited in subsequent blocks, thereby evaluating the presence of Miner Extractable Value (MEV) activity in Starknet. Utilizing the methodology proposed in Krzysztof Gogol’s research, we will analyze market disparities between the Binance exchange and a Constant Product Market Maker in the Starknet ecosystem. For the purposes of this analysis, the Nostra exchange has been designated as the primary focus.
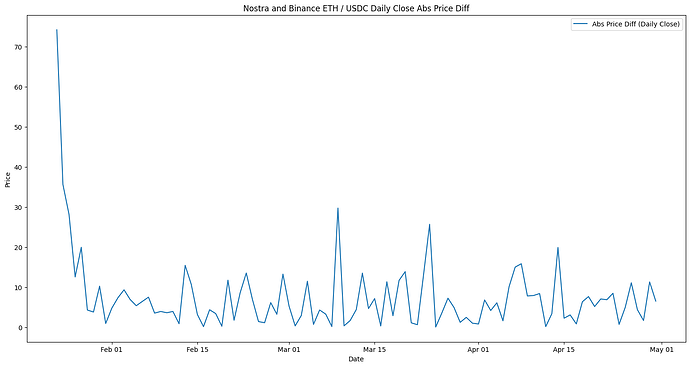
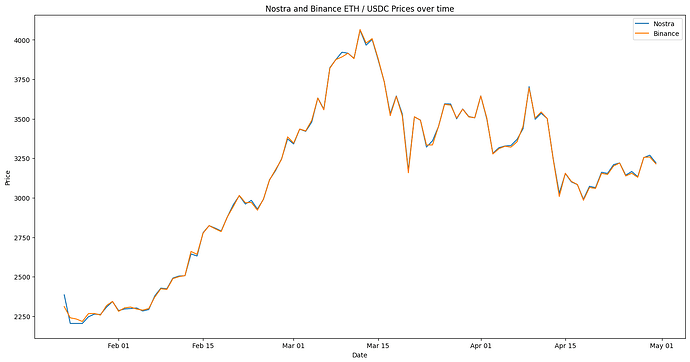
The Nostra ETH/USDC pool commenced its inaugural transaction on January 23, 2024. Our study encompasses data collected from this start date through April 30, 2024. Throughout this period, the average number of swap transactions per block was 0.39, peaking at 29 swap transactions in a single block. For our analysis, data was calculated on a per-block basis, utilizing the closing prices at the end of each block.
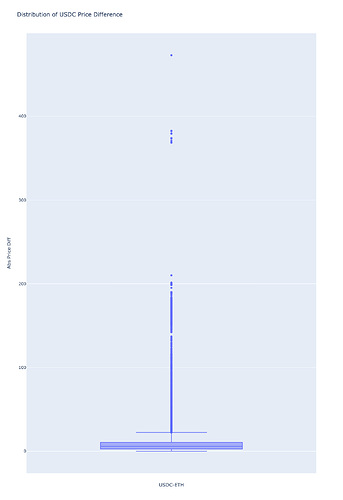
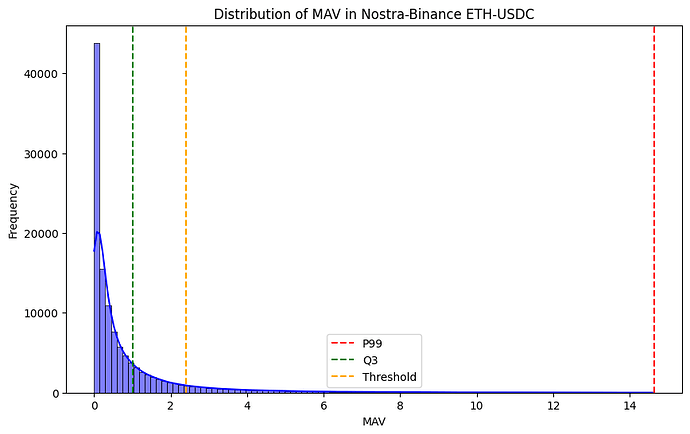
We can now identify real-time arbitrage opportunities thanks to the observed price differences. We operate under the assumption that the price on the centralized exchange (PcPc ) is lower than the price on the decentralized exchange (PaPa ), with the arbitrage extraction executed on the blockchain we aim to mitigate. Upon determining the price differences (Pc−PaPc−Pa ), we will collect these data points and select the profitable opportunities using Tukey’s Method. This approach involves determining the threshold based on the Interquartile Range (IQR) to identify significant outliers that represent viable arbitrage opportunities.
Maximal Arbitrage Value
Now that we have established the necessary components, let’s define the Maximal Arbitrage Value (MAV) specifically for Constant Product Market Makers (CPMMs). The MAV formula is as follows:
Price AMM (P_a): Price in USDC in the DEX, in this case, Nostra V2 ETH / USDC.
Price CEX (P_c): Price in USD in the CEX, in this case, Binance.
USDC Liquidity AMM (y): Total liquidity in the AMM pool.
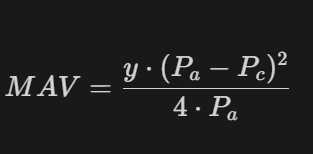
In the context of the Maximal Arbitrage Value (MAV) formula for CPMMs, yy represents the USD liquidity available in the Automated Market Maker (AMM) pool. This liquidity measure is crucial as it impacts the maximum volume that can be effectively traded without excessively moving the market prices, thereby influencing the potential profitability of arbitrage opportunities.
Now we can compare the amount of MAV and arbitrage opportunities of Nostra compared with Uniswap in the different Optimistc Rollups:
| Chain | Swaps | Total Volume mn | Avg Swap Volume | Std Swap Volume | Median Swap Volume | Maximal Arbitrage Value |
|---|---|---|---|---|---|---|
| Ethereum | 761,005 | 35,175 | 46,222.26 | 142,890.62 | 4,239.45 | 52,488,479.88 |
| Arbitrum | 2,400,000 | 7,266 | 3,027.66 | 6,738.06 | 1,125.01 | 2,699,032.60 |
| Arbitrum (USDC.e) | 2,258,469 | 8,159 | 3,612.86 | 5,976.01 | 2,201.23 | 2,707,008.96 |
| Base | 1,687,530 | 2,996 | 1,775.55 | 5,611.25 | 173.46 | 1,293,771.96 |
| Optimism (USDC.e) | 1,186,780 | 1,457 | 1,228.30 | 2,842.73 | 331.28 | 690,868.44 |
| Starknet (Nostra ETH / USDC V2) | 47,453 | 5.62 | 118.52 | 562.96 | 72.85 | 174,380.46 |
| zkSync (USDC.e) | 46,417 | 8.01 | 172.67 | 426.52 | 20.99 | 20,110.31 |
Based on our initial metrics, one might initially conclude that the Maximal Arbitrage Value (MAV) in the Starknet Nostra V2 pool is less than that observed in other major blockchains such as Arbitrum, Base, or Optimism Uniswap V3 pools.
Interestingly, when comparing with zkSync’s Uniswap V3, the selected Starknet CPMM pool presents MAV despite having lower volume.
Given the MAV and volume of the pool for each blockchain, we can normalise the MAV by the pool volume:
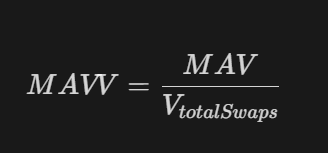
Normalization is crucial to grasp the financial impact of rebalancing across different chains, such as Uniswap protocol v3 and Nostra on Starknet. It’s worth noting that discrepancies are anticipated due to the tick system, which enhances security against arbitrage and provides increased protection for Liquidity Providers.
Now that we’ve identified the potential for profitable statistical arbitrage between Binance and Nostra, it’s crucial to delve deeper into the activity and transaction volume within the Starknet Blockchain. Our next step is to thoroughly examine the top three opportunities that exhibit the largest price discrepancies—referred to as “deltas.” By analyzing these significant deltas, we can better understand the conditions and timings that lead to the most lucrative arbitrage opportunities. This deeper investigation will not only help in pinpointing the best moments for executing trades but also in strategising how to efficiently capitalize on these discrepancies in future transactions.
| Block Number | Price AMM | Price CEX | USDC Liquidity AMM | ETH Liquidity AMM | MAV | Abs Price Difference ($) | Abs Price Difference (%) |
|---|---|---|---|---|---|---|---|
| 596003 | 3918.69 | 3445.80 | 682722.95 | 174.22 | 2485.57 | 472.89 | 13.72% |
| 601412 | 3470.64 | 3260.55 | 598261.90 | 172.38 | 548.06 | 210.09 | 6.44% |
| 557430 | 3135.79 | 2934.32 | 462271.33 | 147.42 | 477.03 | 201.47 | 6.87% |
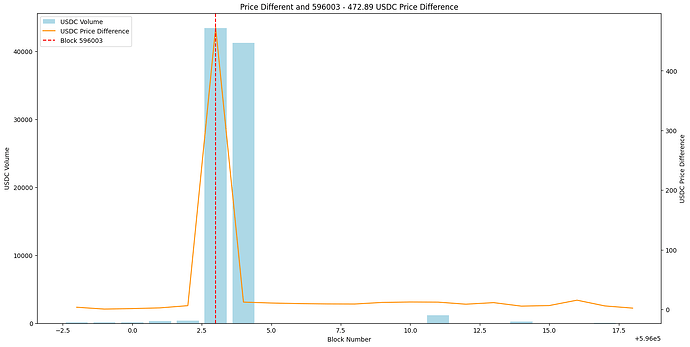
Outlier #1: Block Number 596003 - 472.89 USDC Price Difference
The first outlier represents the block with the highest MAV found in this study. High volume drove the price of ETH up in the AMM, creating an arbitrage opportunity that was quickly seized.
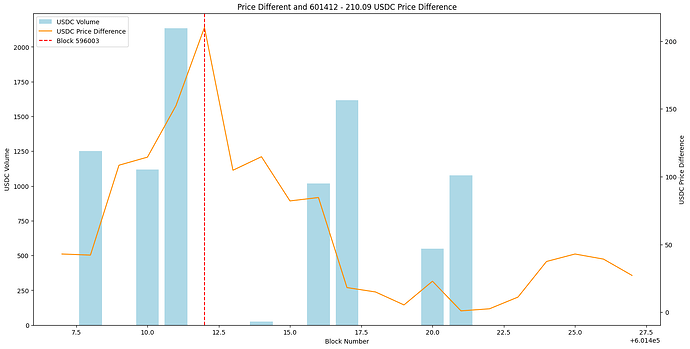
Outlier #2: Block 601412 - 210.09 USDC Price Difference
In this second outlier, the price difference significantly decreases after the opportunity emerges. However, there remains a price difference that can be capitalized on. The opportunity becomes even more appealing considering that the price difference completely disappears after several blocks. Additionally, the trading volume has notably increased from four blocks in advance. This suggests that there is potential for profitable trades during this window, as the price convergence and increased volume present favourable conditions for capitalizing on the remaining price discrepancy.
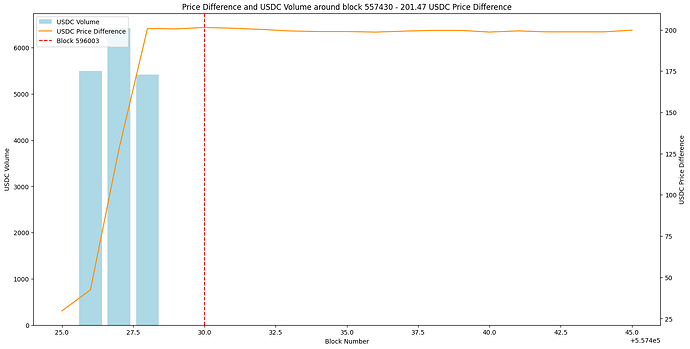
Outlier #3: Block 557430 - 201.47 USDC Price Difference
In the case of the third largest outlier, no significant action was taken within the subsequent 15 blocks. Our primary hypothesis, based on these last two plots, is that there is likely limited MEV activity, particularly in the area of Good MEV, such as Statistical Arbitrage. This suggests that such opportunities have not been thoroughly explored. Consequently, this presents a compelling opportunity to develop MEV bots to detect and capitalize on these arbitrage opportunities.
CONCLUSIONS
In this article, we explored the extent of arbitrage opportunities available in Nostra Starknet and compared them with those in the Uniswap v3 protocol across multiple chains. Surprisingly, Nostra presents the most significant opportunities for trading against Binance, largely due to its v2 model for Automated Market Makers. Contrary to expectations, these opportunities remain largely unexploited relative to the potential profits they offer. Therefore, we encourage researchers within the community to further explore the Starknet ecosystem.
Analysis on Ekubo are being worked
REFERENCES
Krystof Gogol et. al. [2406.02172] Layer-2 Arbitrage: An Empirical Analysis of Swap Dynamics and Price Disparities on Rollups
