By Jonas (@mempirate) and Lorenzo (@thedevbirb) from Chainbound.
TLDR; Chainbound collaborated with Flashbots to deprecate its original orderflow proxy implementation in Go in favor of a new one built in Rust, created with the goal of reducing end-to-end latency and increasing observability in BuilderNet. We’re calling it FlowProxy. Over a 1-month period, we picked up the work on the new Rust implementation to get it production ready. Along the way, we carefully profiled and benchmarked any changes to ensure they met BuilderNet performance requirements. We write about this journey below. FlowProxy has been live on all BuilderNet instances since October 17th.

Table of Contents
- Background
- Methodology
- Stage 1: Network simulation & profiling
- Stage 2: Live testing
- Findings
- Signature Verification
- Freebies by Rust
- Lessons Learned
- Shadow & Simulation
- HTTP Connection Pools
- Next Steps
- mTLS
- Replace or Upgrade HTTP
Background
The orderflow proxy is a central component in BuilderNet. It’s responsible for receiving bundles and transactions from users, and ensuring those orders are shared with all other instances in BuilderNet, as well as to the local rbuilder. Performance is an important aspect here: the faster these proxies can share orders, the more effective the builders will be able to collaborate, and the more blocks BuilderNet as a whole will win. If a proxy goes down for even a couple of seconds, that could mean 1000s of lost orders, so reliability is crucial too.
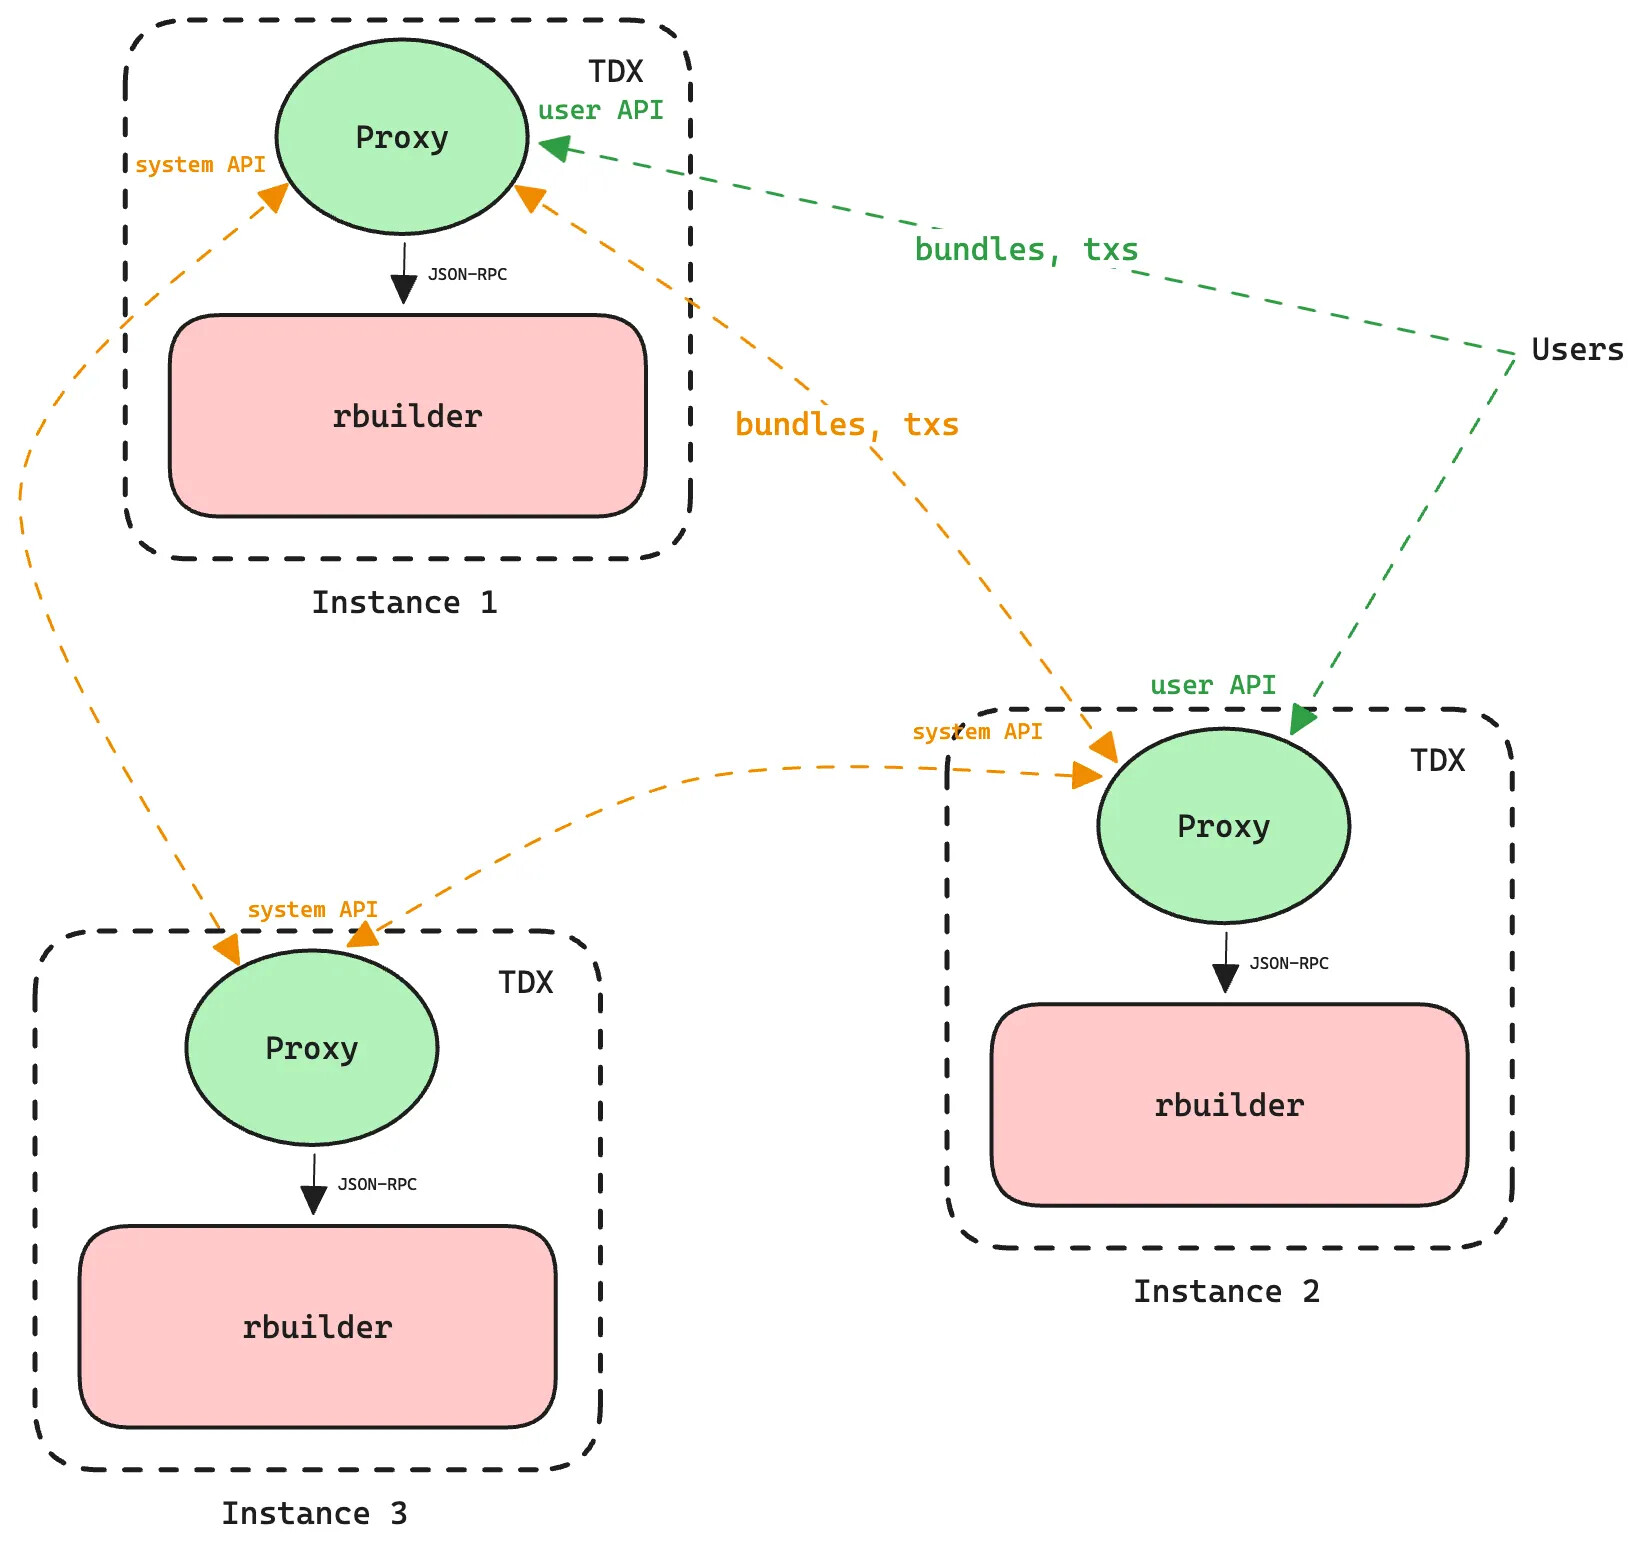
Simplified diagram of BuilderNet topology
For all of these reasons, it was decided that the successor to the legacy proxy should be written in Rust. We were tasked with taking over the initial work and making it production ready. One of our goals was to ensure this new version would outperform v1, without any drastic changes yet. In this post, we’ll go over our methodology, findings and challenges.
Methodology
The first goal of this project was to create a realistic testbed for integration tests, e2e tests, compatibility tests, profiling CPU and measuring network throughput and latencies. These last 3 measurements would help us assess, quite quickly, if we’re meeting the performance requirements as we continued the development.
When talking about performance in this context, we’re primarily talking about various types of latencies or delays. Examples of manifestations that are relevant here include processing latencies, where the CPU is busy doing some computations (in the critical path), and network latencies between instances determined by their physical distance and link capacities.
We can define the critical path as follows: the “wire-to-wire” latency between the proxy receiving an order, and the order leaving the program to be sent to the next destination. This primarily includes a bunch of order validation routines and some cryptographic operations such as signature verification.
Stage 1: Network simulation & profiling
To replicate a realistic testbed we turned to Shadow, a discrete-event network simulator that directly executes your binaries as-is. It allows you to specify network topologies in scenario files that will result in modified traffic patterns to follow these configured bandwidths and latencies. Shadow directly intercepts syscalls coming from your binary, and in the case of intercepted network packets, will route them over its simulated, deterministic networking stack.
We created a scenario that mirrored a real-world BuilderNet deployment, and then replayed live traffic captured previously at various rates. We then captured packets, logged the timestamps for order receipts at all the proxies, and profiled the application with perf and flamegraph. With some additional tooling, we could very quickly iterate on changes and see the direct impact in the form of outputs like (printout of ./sim.sh process):
Processing results/bundle_receipts_2025-10-03-08-57-50_runtime-5m_scale-5.parquet, results/proxy1_eth0_2025-10-03-08-57-50_runtime-5m_scale-5_summary.csv and results/proxy2_eth0_2025-10-03-08-57-50_runtime-5m_scale-5_summary.csv...
Number of rows:
   ┌─count(bundle_hash)─┐
1. │             177985 │
   └────────────────────┘

Aggregated statistics:
   ┌─────────────avg_us─┬─p50_us─┬─p90_us─┬─p99_us─┬─p999_us─┬─min_us─┬─max_us─┬────────────corr_tp─┬─────────avg_size─┬─p50_size─┬─p90_size─┬─p99_size─┐
1. │ 44447.021855774365 │  44004 │  44008 │  48994 │  132006 │  44003 │ 220050 │ 0.1461330024788131 │ 6894.85476304183 │     2966 │    19376 │    40390 │
   └────────────────────┴────────┴────────┴────────┴─────────┴────────┴────────┴────────────────────┴──────────────────┴──────────┴──────────┴──────────┘

Bandwidth usage data:
   ┌─host─────┬─upload_total_MB─┬────upload_avg_Mbps─┬─upload_peak_Mbps─┬─download_total_MB─┬──download_avg_Mbps─┬─download_peak_Mbps─┐
1. │ 10.0.0.3 │     2692.634864 │ 104.56834423300971 │       930.272048 │          127.1639 │  4.938403883495146 │          23.797824 │
2. │ 10.0.0.4 │        127.1639 │  4.938403883495146 │        23.797824 │       2692.634864 │ 104.56834423300971 │         930.272048 │
   └──────────┴─────────────────┴────────────────────┴──────────────────┴───────────────────┴────────────────────┴────────────────────┘
Or flamegraphs like:
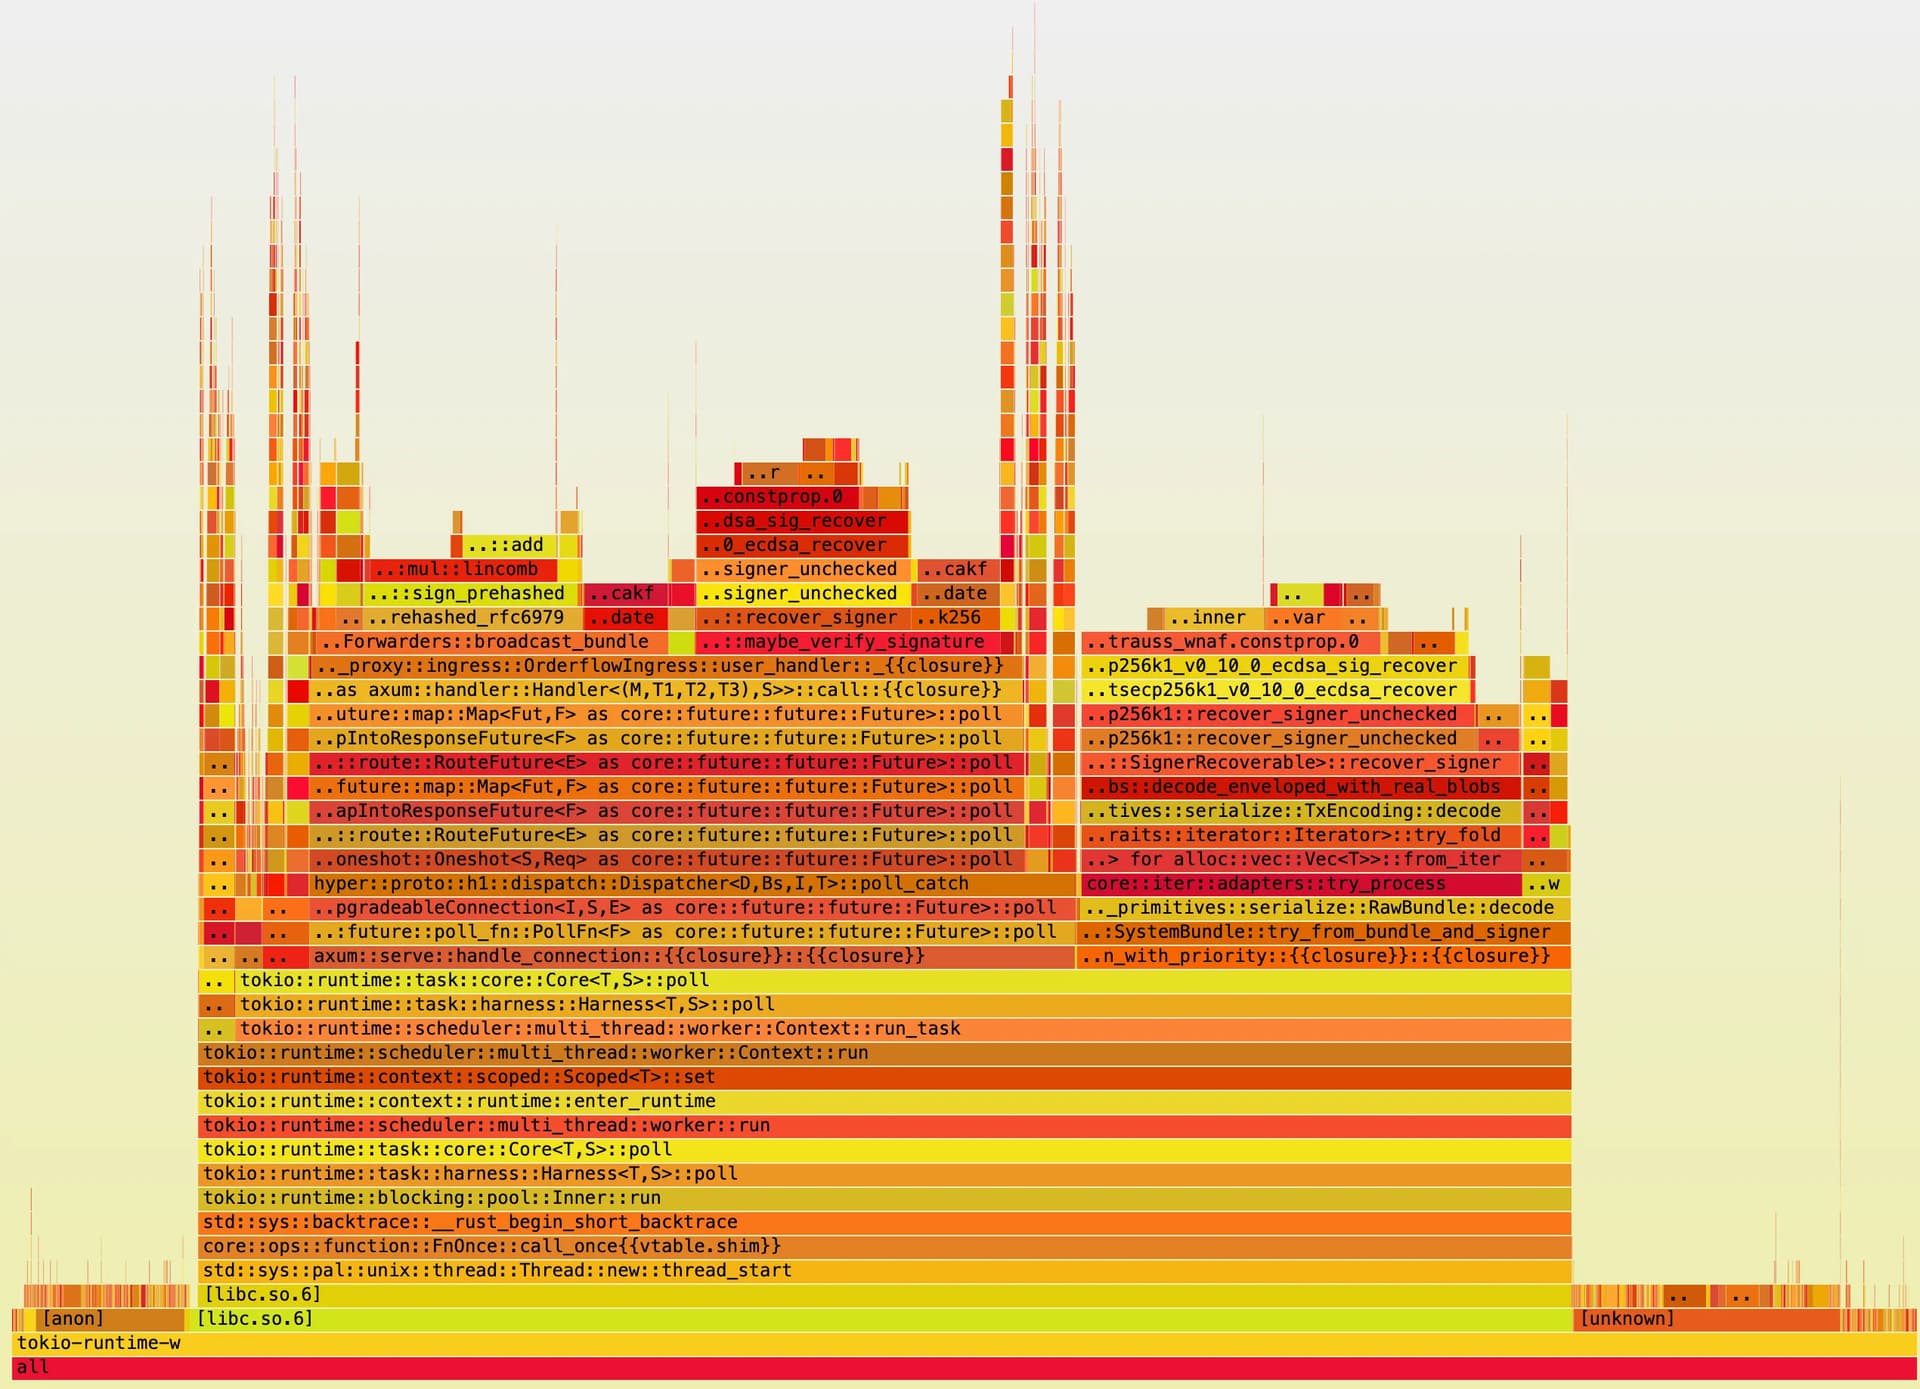
We won’t go into all the information that is displayed here, but it allowed us to identify processing bottlenecks, bandwidth usage, and network latencies. It also offers a robust e2e testing environment that can be very realistic, and it helped us uncover a lot of bugs and implementation differences with the v1 proxy. However, there are some important caveats to Shadow that we’ve outlined in a section below.
Stage 2: Live testing
Once we got to feature parity with the v1 proxy, and understood the initial CPU profiles and networking results, it was decided to move to live testing. Simulation can only get you so far. Because of some Shadow limitations that we discuss below, and the fact that real orderflow proxies run inside of TDX, realistic measurements would need to be obtained in live environments.
Two existing BuilderNet instances were upgraded to use FlowProxy. The rest of the analysis was all done using real metrics from the live deployment.
Findings
Below we’ll talk about some of the initial findings encountered. Note that performance was not the main goal of this project, but there were some low hanging fruits that we’ll talk about below.
Signature Verification
In stage 1, looking at some profiling results in the form of flamegraphs, it was immediately obvious that ECDSA signature verification was claiming the bulk of CPU cycles. This was true for both ingress proxies (who directly receive orders from users), and receiving proxies (who get forwarded these orders by the ingress proxies). In addition, ingress proxies that had to forward data also spent quite some time on hashing and signing messages.
Signature verification happens in roughly 3 places:
- Verifying the
X-Flashbots-Signatureheader when receiving orders from users (on the user endpoint); - Verifying the signature on the transactions present in bundles as part of the bundle validation process → Greatly amortised with a cache, see below;
- Verifying the
X-Flashbots-Signatureheader when receiving orders from other proxies (on the system endpoint).
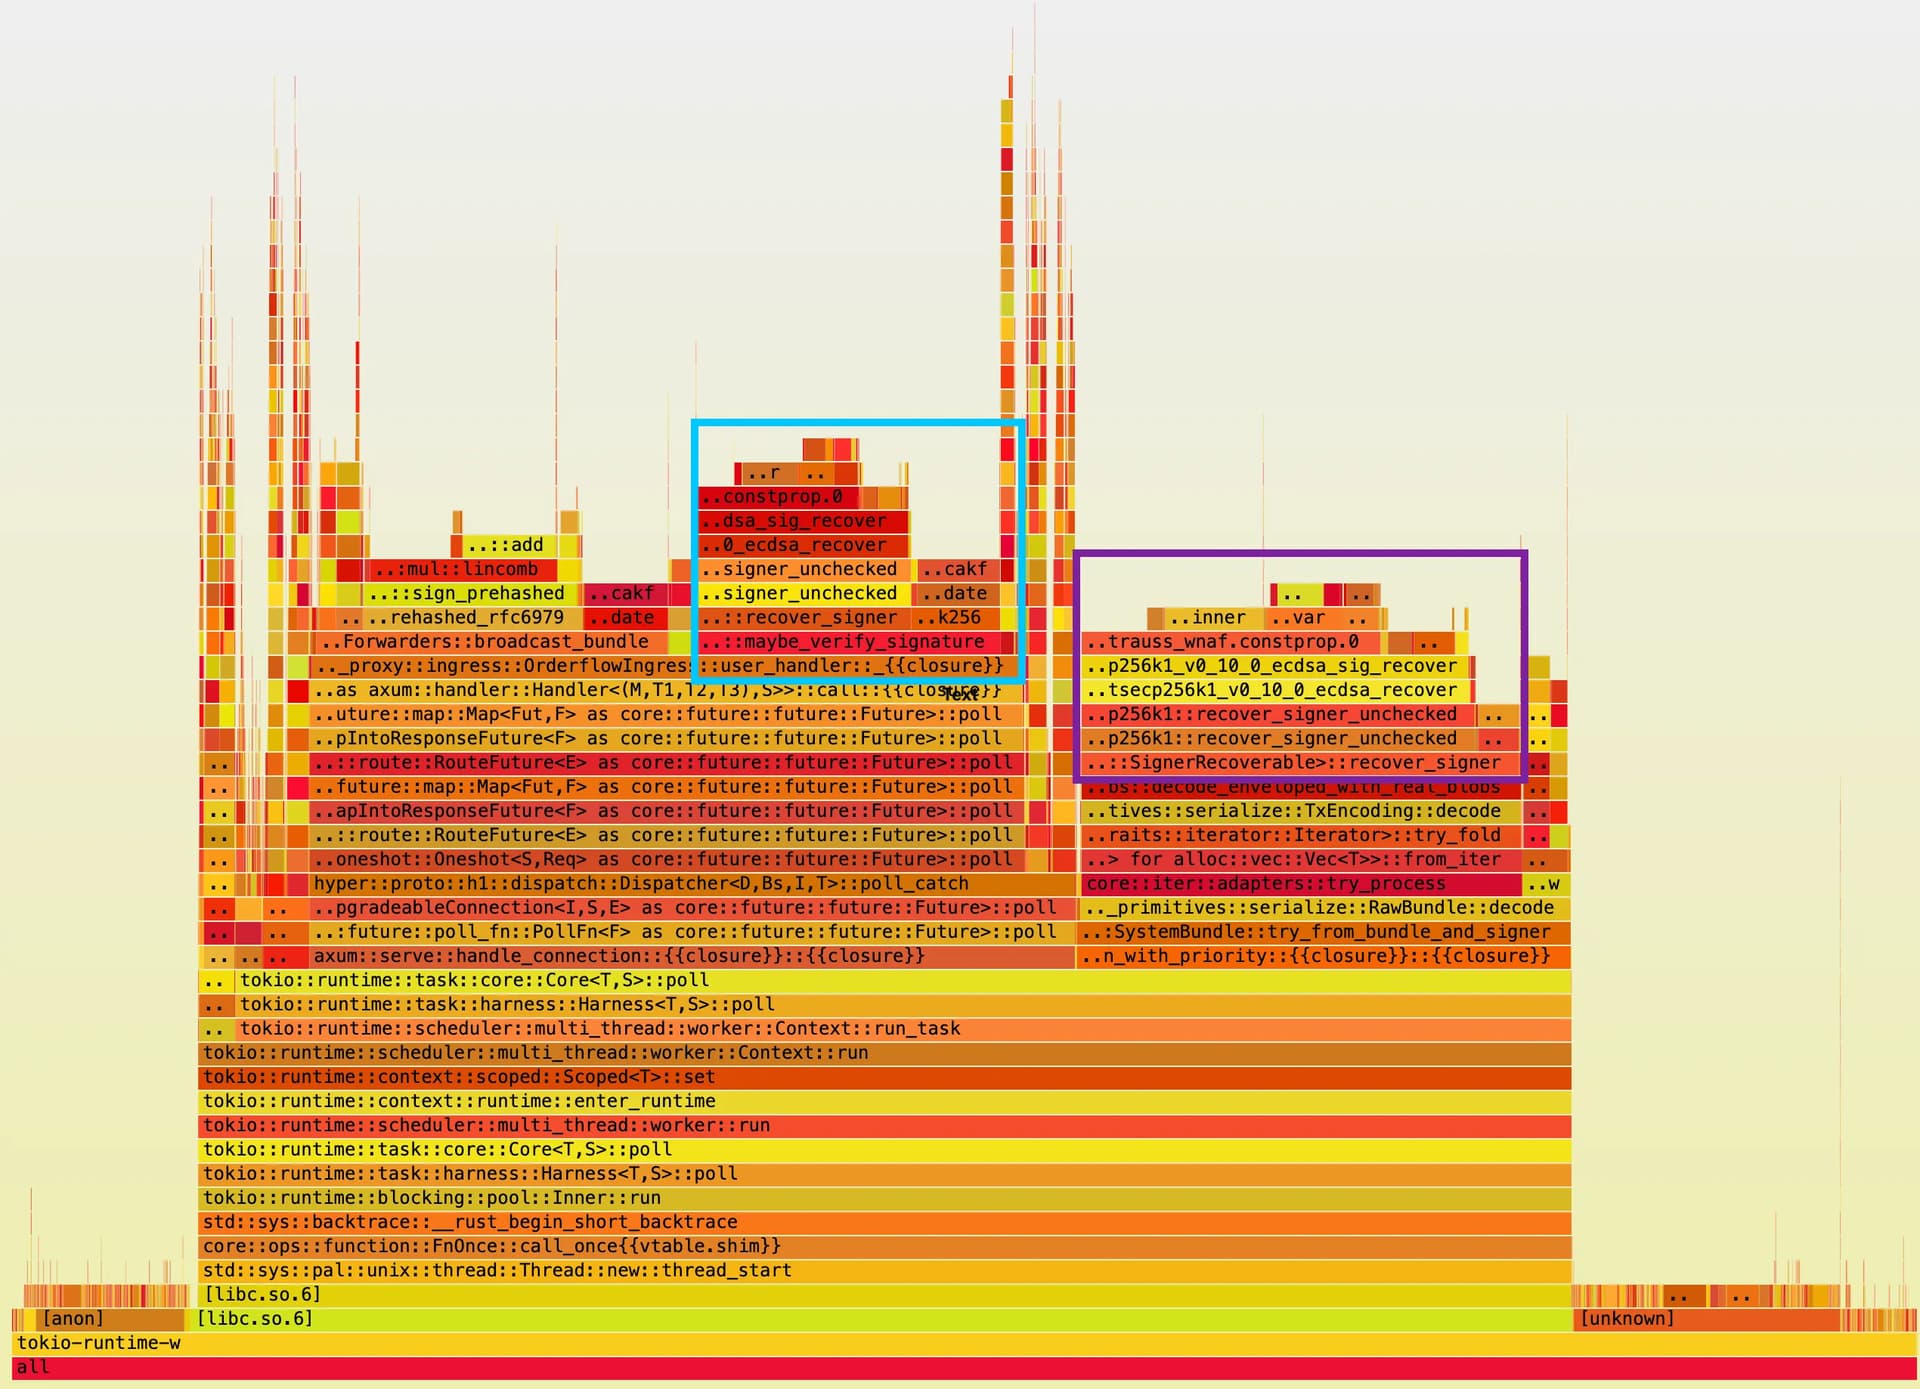
CPU profile on an ingress-only proxy: blue box is X-Flashbots-Signature header verification, purple box is transaction signature verification. Together they account for roughly 40% of CPU time spent.
Verifying the signature headers on user requests is absolutely necessary to authenticate and score users, but could we decrease the other types of verification?
Turns out, when looking at real data, that most bundles contain duplicate transactions (up to 90% in some deployed instances). As such, we can store the result of transaction signature recovery (the signer) in a small cache that maps transaction hashes to signer addresses, and do a very cheap lookup on any incoming transactions to reuse the verification result. By doing this we have observed instances on Mainnet showing a transaction signature recovery cache hit ratio of up to 70%, ****meaning that time spent validating transaction signatures in bundles has been decreased by the same amount.
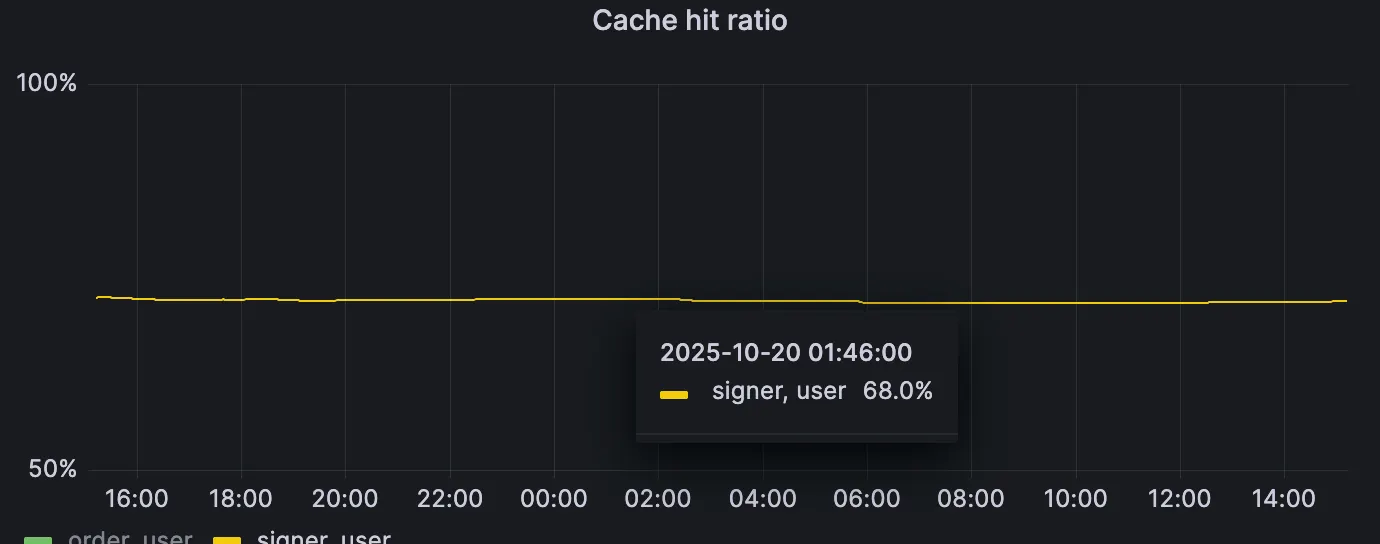
Proxy v2 running with transaction signature cache. For this instance we have that 68% of the requests received contain already processed transactions for which we can skip signature recovery. TTL applied is 36s.
Verifying system signatures (point 3 above) is another issue that we haven’t addressed yet. We’ll revisit this in the next steps section below.
Freebies by Rust
Some metrics improved quite drastically by just switching to Rust. We’ll focus on some of the network-related latencies in the graphs below:
Cross-region RPC
These 2 graphs show the P99 of cross-regional RPC call durations for the v1 and v2 proxies. The first pair is small requests, and the second pair is for big requests (> 50KB).
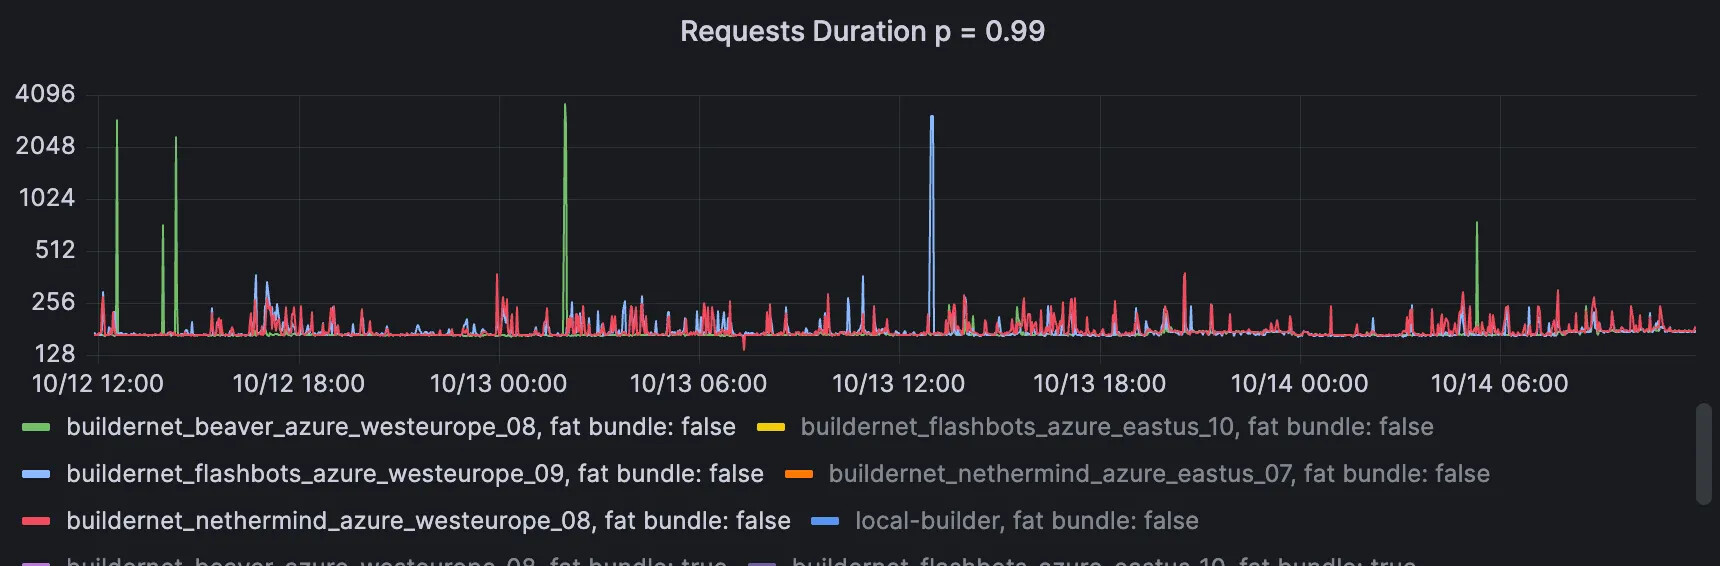
Proxy v1, small requests (<50KB). Range over 2 days: 137ms → 3.6sec
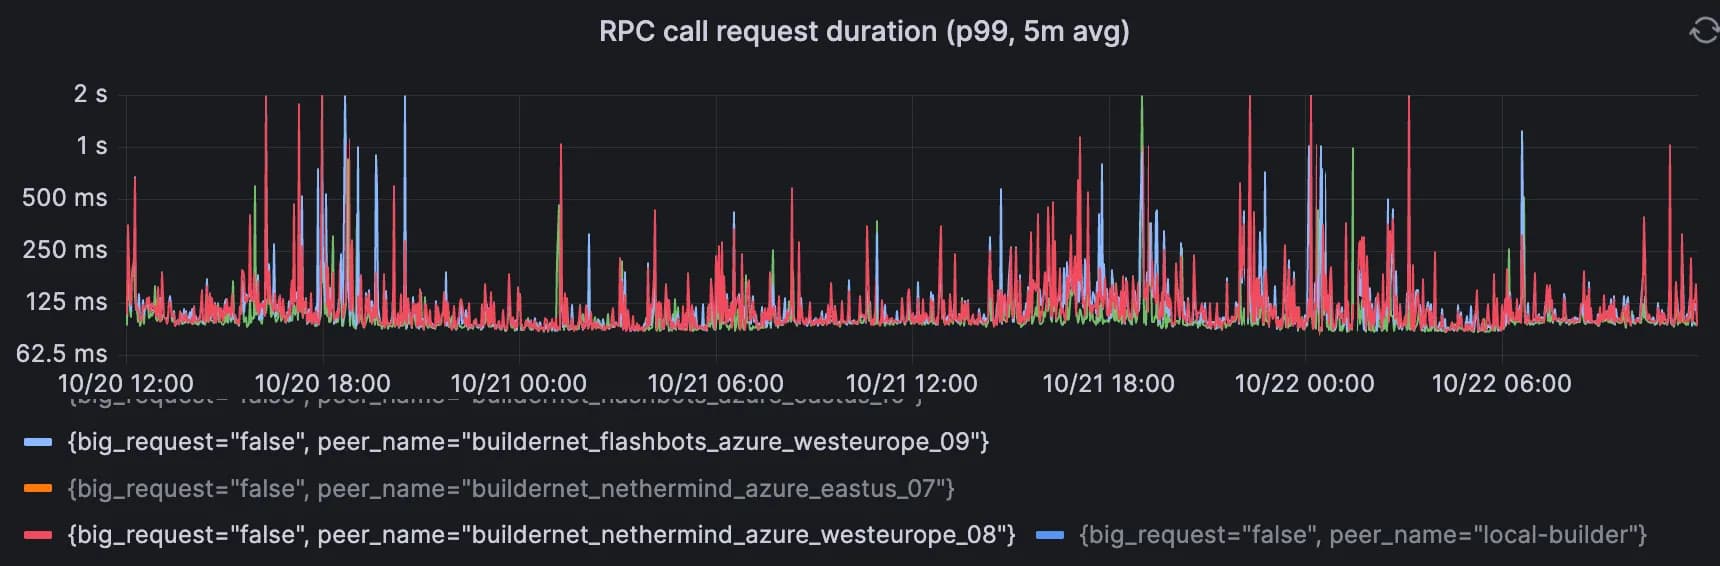
Proxy v2, small requests (< 50KB). Range over 2 days: 85ms → 2sec
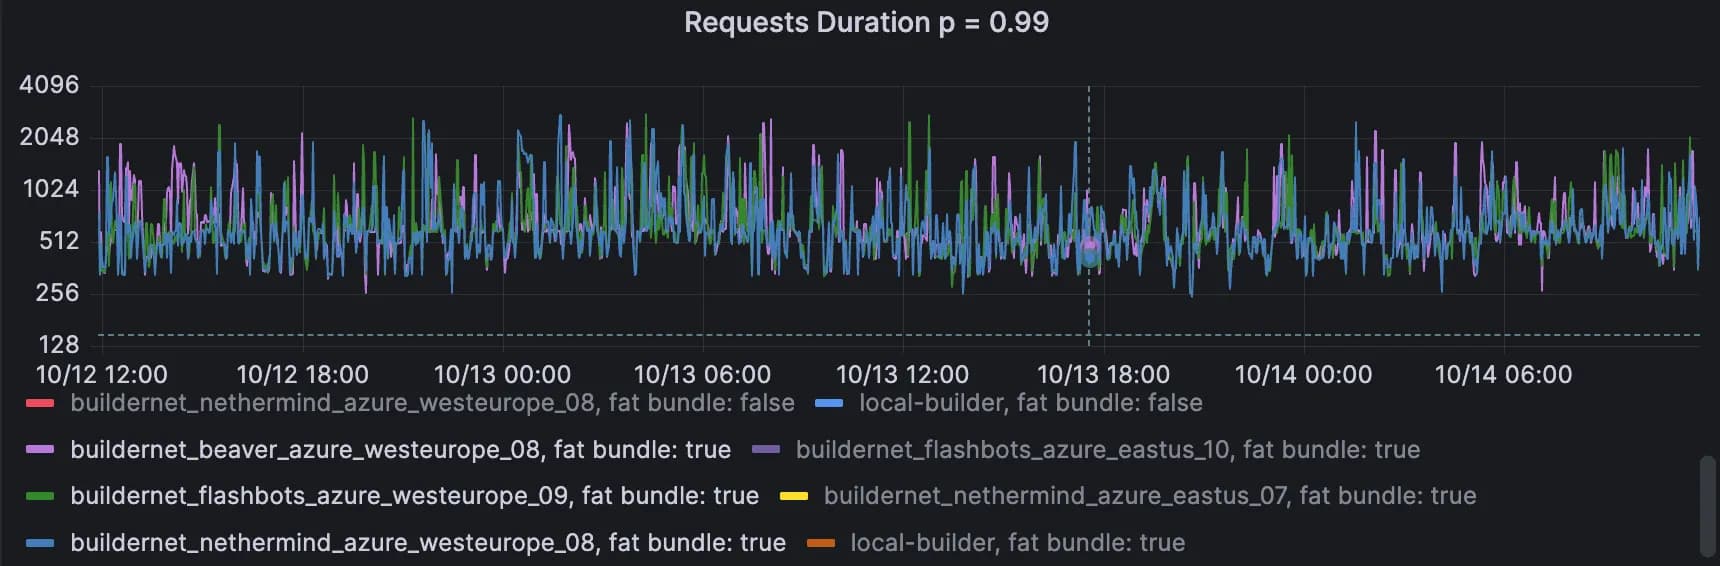
Proxy v1, big requests (> 50KB). Range over 2 days: 260ms → 2.8sec
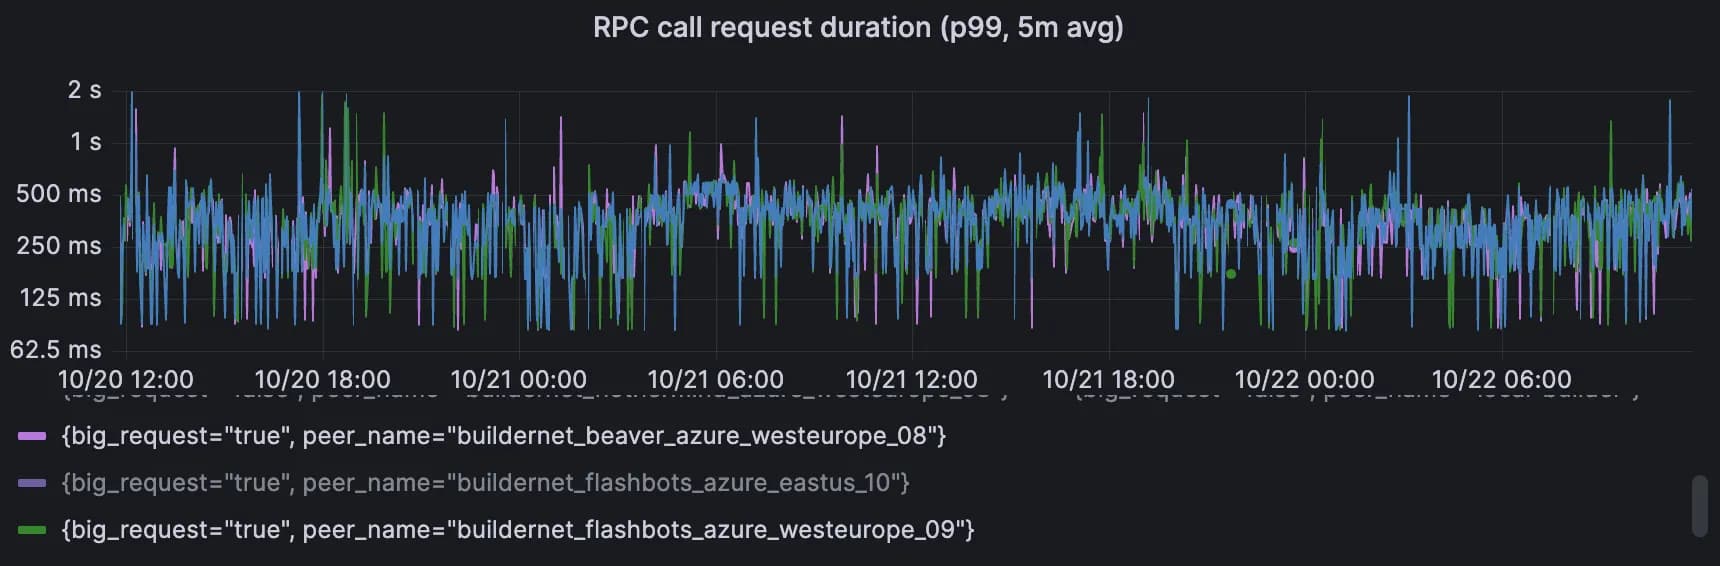
Proxy v2, big requests (> 50KB). Range over 2 days: 85ms → 2sec
Lessons Learned
Shadow & Simulation
Since Shadow is a discrete-event simulator, it has a notion of time that is purely tied to network events. If no network events are sent, time (from the perspective of your app, since Shadow intercepts timings syscalls as well) does not progress. That means you can’t use Shadow to accurately measure processing latencies, since Shadow won’t progress the time your app sees on compute only.
Additionally, micro-benchmarking a single connection by, for example, comparing different transport protocols such as HTTP or gRPC, will also not give you the most accurate results. This is because the simulated networking stack is also completely written from scratch to be deterministic, and the way TCP is implemented is not exactly the same as it would be in the Linux kernel, for example. One very real example here is TCP send & receive buffer sizes, or congestion control protocols, both of which can have major impacts. In Shadow, these are not as configurable as in the Linux kernel.
If we were to do this again, we would most likely use something like tc netem on Linux to emulate networking (instead of simulating), which reuses the kernel’s networking stack. In fact, the ease of setting up and running scenarios with Shadow, combined with the realistic emulation of tc netem would be a great project if anyone is interested.
HTTP Connection Pools
The v1 proxies use JSON-RPC over HTTP to forward orders to each other, which is something v2 also does for backwards compatibility reasons. When initially running the Go proxy in Shadow, we noticed that we couldn’t saturate even 1% of the capacity of the simulated link (1 Gbps). After looking into it a bit further, the culprit was a disabled HTTP connection pool, which resulted in the proxy only using 1 underlying TCP connection to send data over. Since HTTP 1.1 (which is what’s currently used) does not pipeline or multiplex, it supports only 1 inflight request per TCP connection! This obviously throttles throughput enormously, especially on long RTT links (which was the case at 88ms RTT). After enabling a connection pool of 300 connections, we were able to almost saturate the bandwidth of the link, and the issue was solved.
This was something we kept in mind for the Rust proxy, where the HTTP client library we used was reqwest. Reqwest, by default, does not allow a lot of granular control over underlying connection pools, and in fact will open 1000s of connections if it needs to, exhausting the system of underlying ephemeral ports. This happened occasionally when incoming requests (and thus forwarding requests) spiked, and we had to introduce functionality to put a hard cap on the amount of available connections.
However, it was still noticed that there were a lot of connection attempts on the server side of any proxy, many more than before. Additionally, the number of timeouts increased drastically, which would result in lost orders if not dealt with.
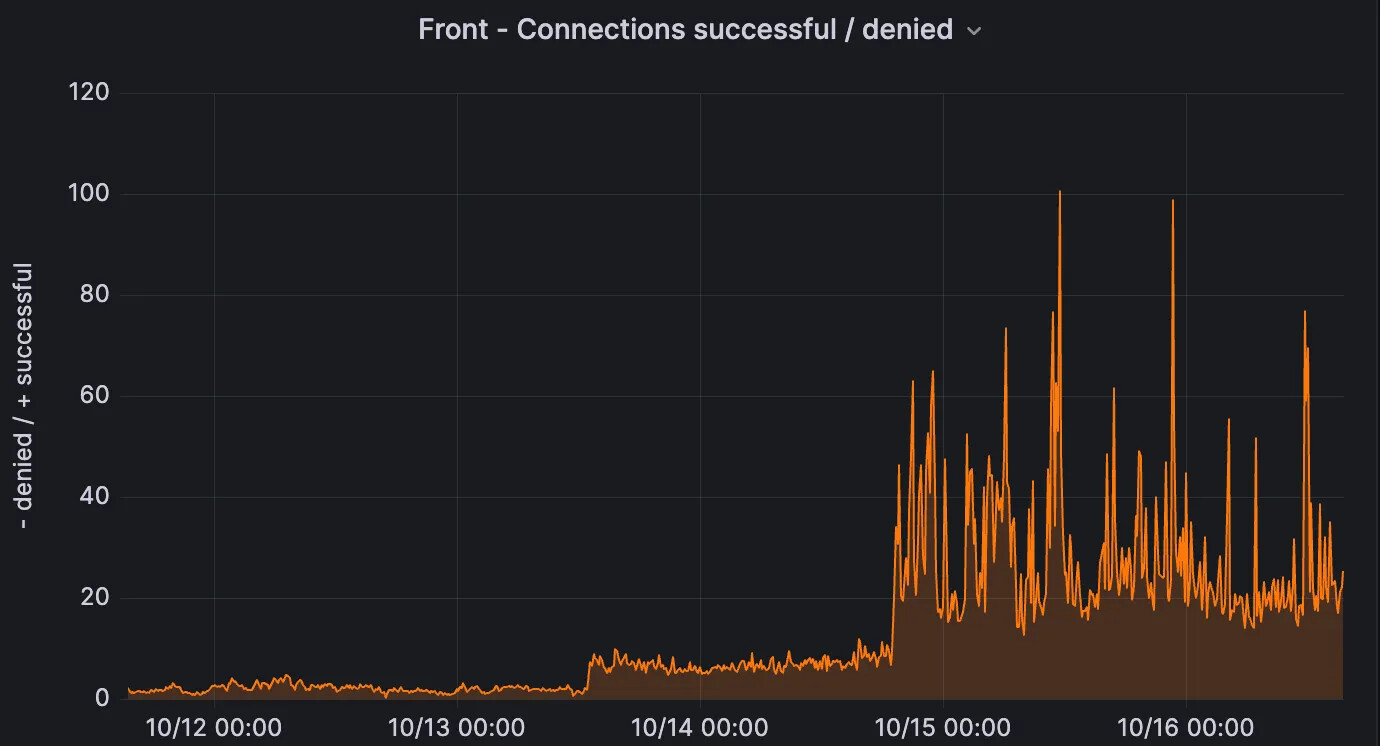
Connection attempts from other proxies on the server side. Spot the upgrade.
After some digging, this turned out to be an issue with the connection pool, and specifically, how connections are reused. Connection pool strategies determine which idle connection is picked up to handle a new request, and for practical purposes can be reduced to either FIFO (oldest idle connections are reused first), or LIFO (most recent connections are reused first). We knew the Go HTTP library used was FIFO. Reqwest, on the other hand (and the hyper connection pool under the hood), uses LIFO.
To recap, this means that new requests are routed to connections that are still “warm”, i.e. have recently been used. In theory, this is fine, and might even result in better performance in some cases due to better CPU cache utilization. However, in a bursty environment, with a slightly misconfigured client, this can result in a lot of cascading failures. With LIFO, a parameter that becomes very important is the idle timeout, an option that can be set on both HTTP server and client. If the server observes a connection that has been idle for more than X seconds (10, in our case), it will close the HTTP session. The problem is that if the client doesn’t close the connection at the same time or earlier, it can only know the session is closed by sending a request to the server!
Imagine the following scenario:
- OF proxy is in a state where it’s happily routing requests over N << 512 (the limit) TCP connections. These are the “warm” connections that continually get re-used.
- A burst of requests come in, and the HTTP client has to start re-using some of the “cold” connections that were opened previously, because current connections are all unavailable.
- However, because these have become stale (i.e. closed by the server’s 10-second idle timeout), our client quickly bursts requests over all of these stale connections, that in a cascading way get closed for new connections to open, which takes time and may result in timeouts and connection bursts.
This issue was fixed by increasing the idle timeout on the server to 30s, and ensuring every HTTP client is configured with an idle timeout slightly less than that. The results can be seen on this server panel:
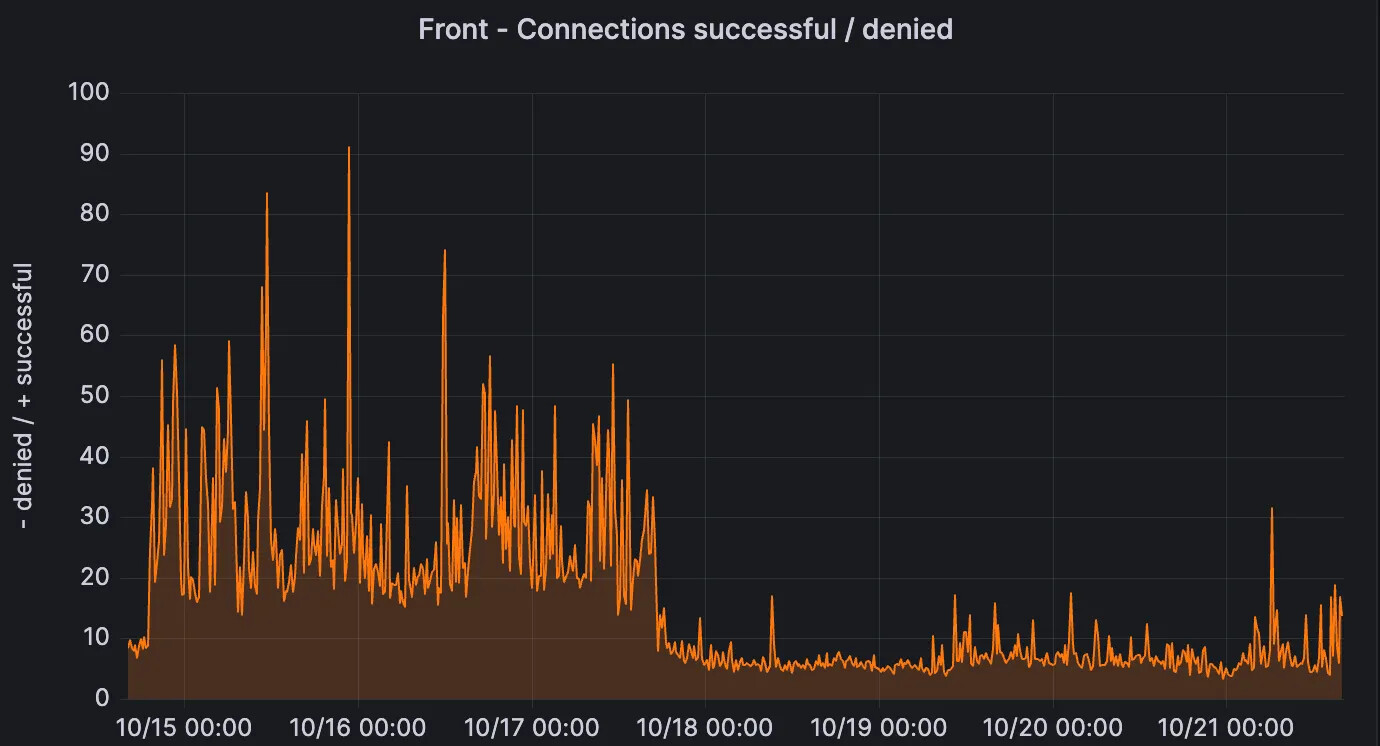
In addition, the HTTP timeouts for long RTT links also decreased since then:
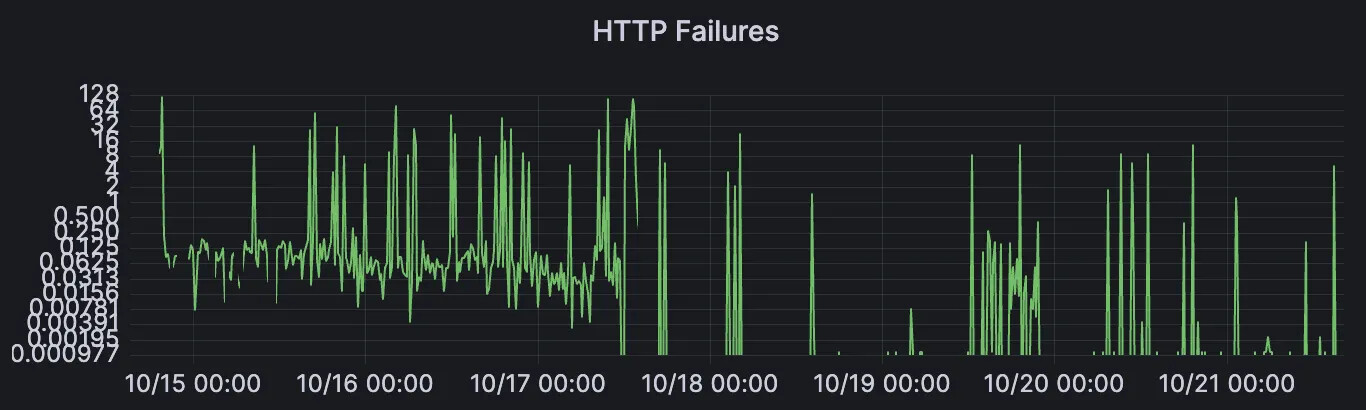
As well as p99 round-trip latencies on those links:
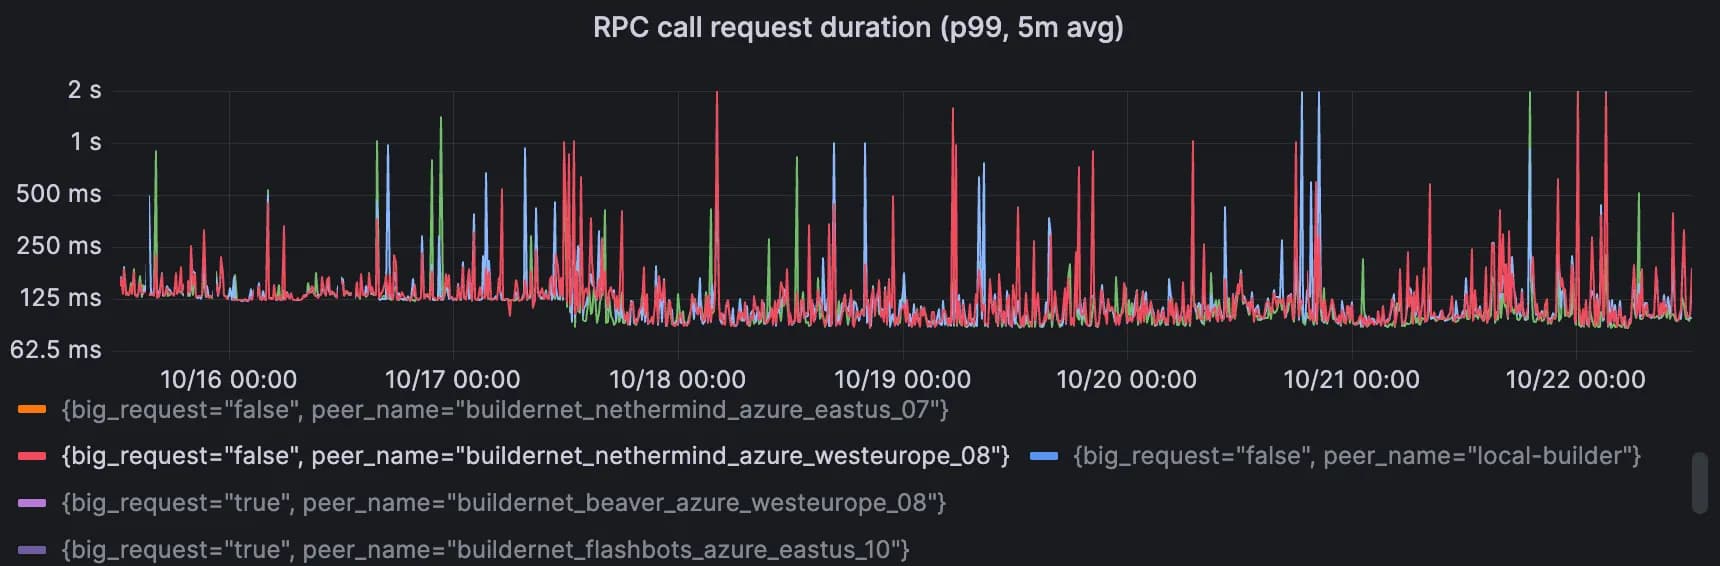
Y-axis is logarithmic, p99 dropped from ~125ms to ~95ms.
The p99 improvement can be attributed to the decrease in these cascading connection failures, which always resulted in a higher RPC latency (since connections needed to be tried, failed, and re-established).
Next Steps
The main goal of this project was to get FlowProxy production ready and deployed. We believe there are still a lot of improvements that can be made to reduce both processing and networking latencies, but this will require extensive profiling and benchmarking in live environments, where we have the realistic overhead of TDX and data center network links. Two potential high-impact improvements come to mind:
mTLS
In the flamegraphs above, we talked about a lot of time being spent doing authentication on the system API, which is used for intra-BuilderNet communication, through signature generation and verification. This is needed because the system API is a public endpoint, which requires authentication. Note that HTTP clients inside of the proxies already authenticate servers (other proxies) through publicly known TLS certificates. If we could use that same mechanism to authenticate clients to servers too, we wouldn’t need signature-based authentication at all on the system API!
Mutual TLS (mTLS) is a standard that solves exactly this. It allows the client to attach a certificate to their connection requests, which the server can then authenticate to allow for mutual authentication. Once authenticated, anything sent over this connection is authenticated by default, which means we can get rid of the signing and signature verification. Since system API authentication takes up a large chunk of CPU time in the proxy, this would drastically improve efficiency and tail latencies.
Replace or Upgrade HTTP
As we saw above, HTTP can cause a lot of headaches, especially in high-load environments like this. The fact that HTTP1.1 does not allow pipelining makes it extremely wasteful with connections, so the first step would be changing to something that allows pipelining / multiplexing. HTTP2 / HTTP3 are options here.
However, we think that messaging libraries that are even more lightweight, and tuneable for different connection types (long links, short links, high bandwidth) are more suitable (request multiplexing is still a requirement). Zeromq, Nanomsg-nng, or our own msg-rs. Switching to a streaming communication pattern (instead of request / reply in HTTP) seems more suitable here.
On a final note, we want to thank Flashbots engineers for helping us debug and monitor live deployments. We hope to report back soon with the results of upcoming improvements.