A Consensus Layer Client Diversity Snapshot
This snapshot presents only the view of proposers using the Flashbots Relay. We encourage other relays to present their own snapshots and help to illuminate consensus layer client diversity.
Data Always - Flashbots Research
December 16, 2025
With the death of blockprint earlier this year, the most reliable source of consensus layer client data now lies with relays. Requests made by proposers carry metadata identifying the sidecar and consensus client, from which market share statistics can be extracted. Relays are particularly useful here because they can tag slots where requests originate from multiple consensus clients and illuminate usage patterns for validators that leverage DVT, Vero, or Vouch. However, we note that Vouch overrides all metadata, making it impossible for relays to determine which consensus clients are used under the hood.
The main drawbacks of using relay data are that it is available only to the relay operator and that a subset of the validator set does not connect to any given relay. Although the Flashbots Relay has a significantly smaller share of payload deliveries than more performant relays, it maintains one of the highest counts of registered validators and is well suited to this analysis.
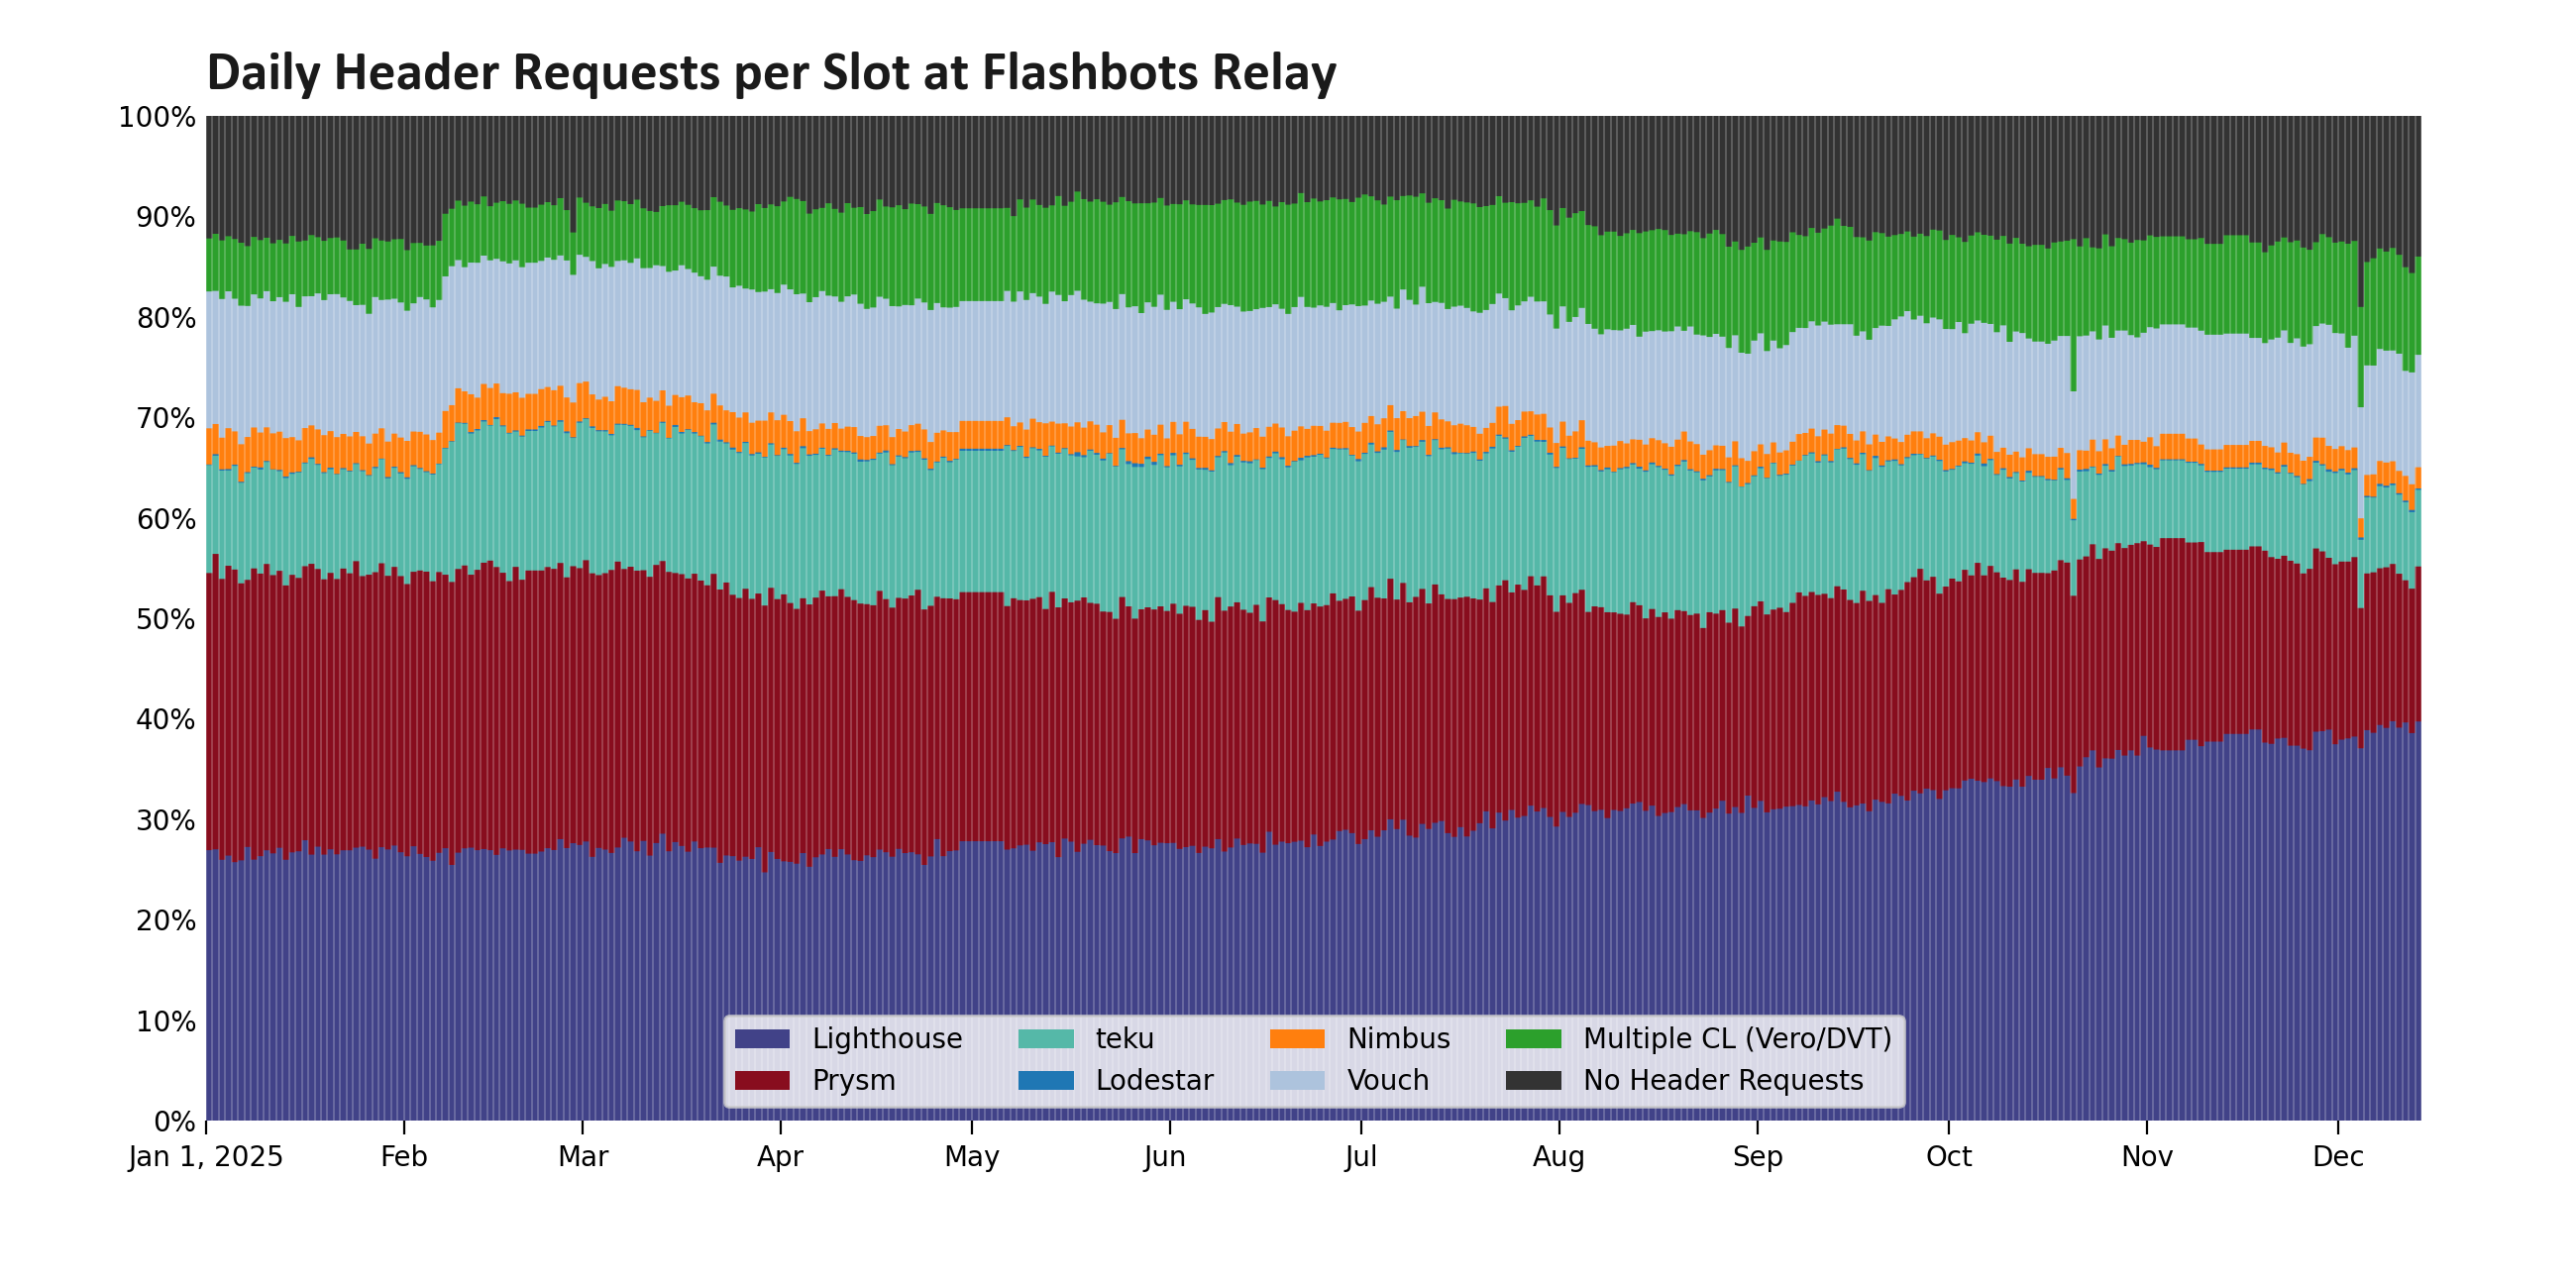
Figure 1: aggregated daily per-slot statistics on consensus layer client adoption by proposers using the Flashbots Relay.
Throughout 2025, weekly measurements show that the share of slots with proposers using only the Lighthouse consensus client rising from 26% to 39%, while the share using only Prysm fell from 28% to 14%. These figures are not scaled for slots where we did not receive header requests (14%); normalizing for that, Lighthouse-exclusive slots represent 45% of our sample.
| Client | January 1-7, 2025 | December 7-13, 2025 |
|---|---|---|
| Lighthouse | 26% | 39% |
| Prysm | 28% | 15% |
| Teku | 10% | 8% |
| Lodestar | < 1% | <1% |
| Nimbus | 3% | 2% |
| Vouch | 13% | 11% |
| Vero/DVT | 8% | 11% |
| Unseen | 12% | 14% |
Table 1: aggregated weekly statistics for the start of 2025 and the current state of consensus layer client adoption by proposers using the Flashbots Relay.
We now analyze the usage of individual clients inside multi-client setups. As noted earlier, for proposers using Vouch we are unable to decode consensus client information; going forward, we treat all Vouch requests as coming from all clients to create an upper bound of client adoption in the ecosystem.
Lighthouse started the year as the second-biggest client used by proposers at the Flashbots Relay, being involved in the process for up to 51% of slots when including Vouch. Today that share has risen to 69%, with approximately two-thirds of these slots coming from proposers who exclusively use Lighthouse, and the remaining one-third split between Vouch and other multi-client validator technologies.
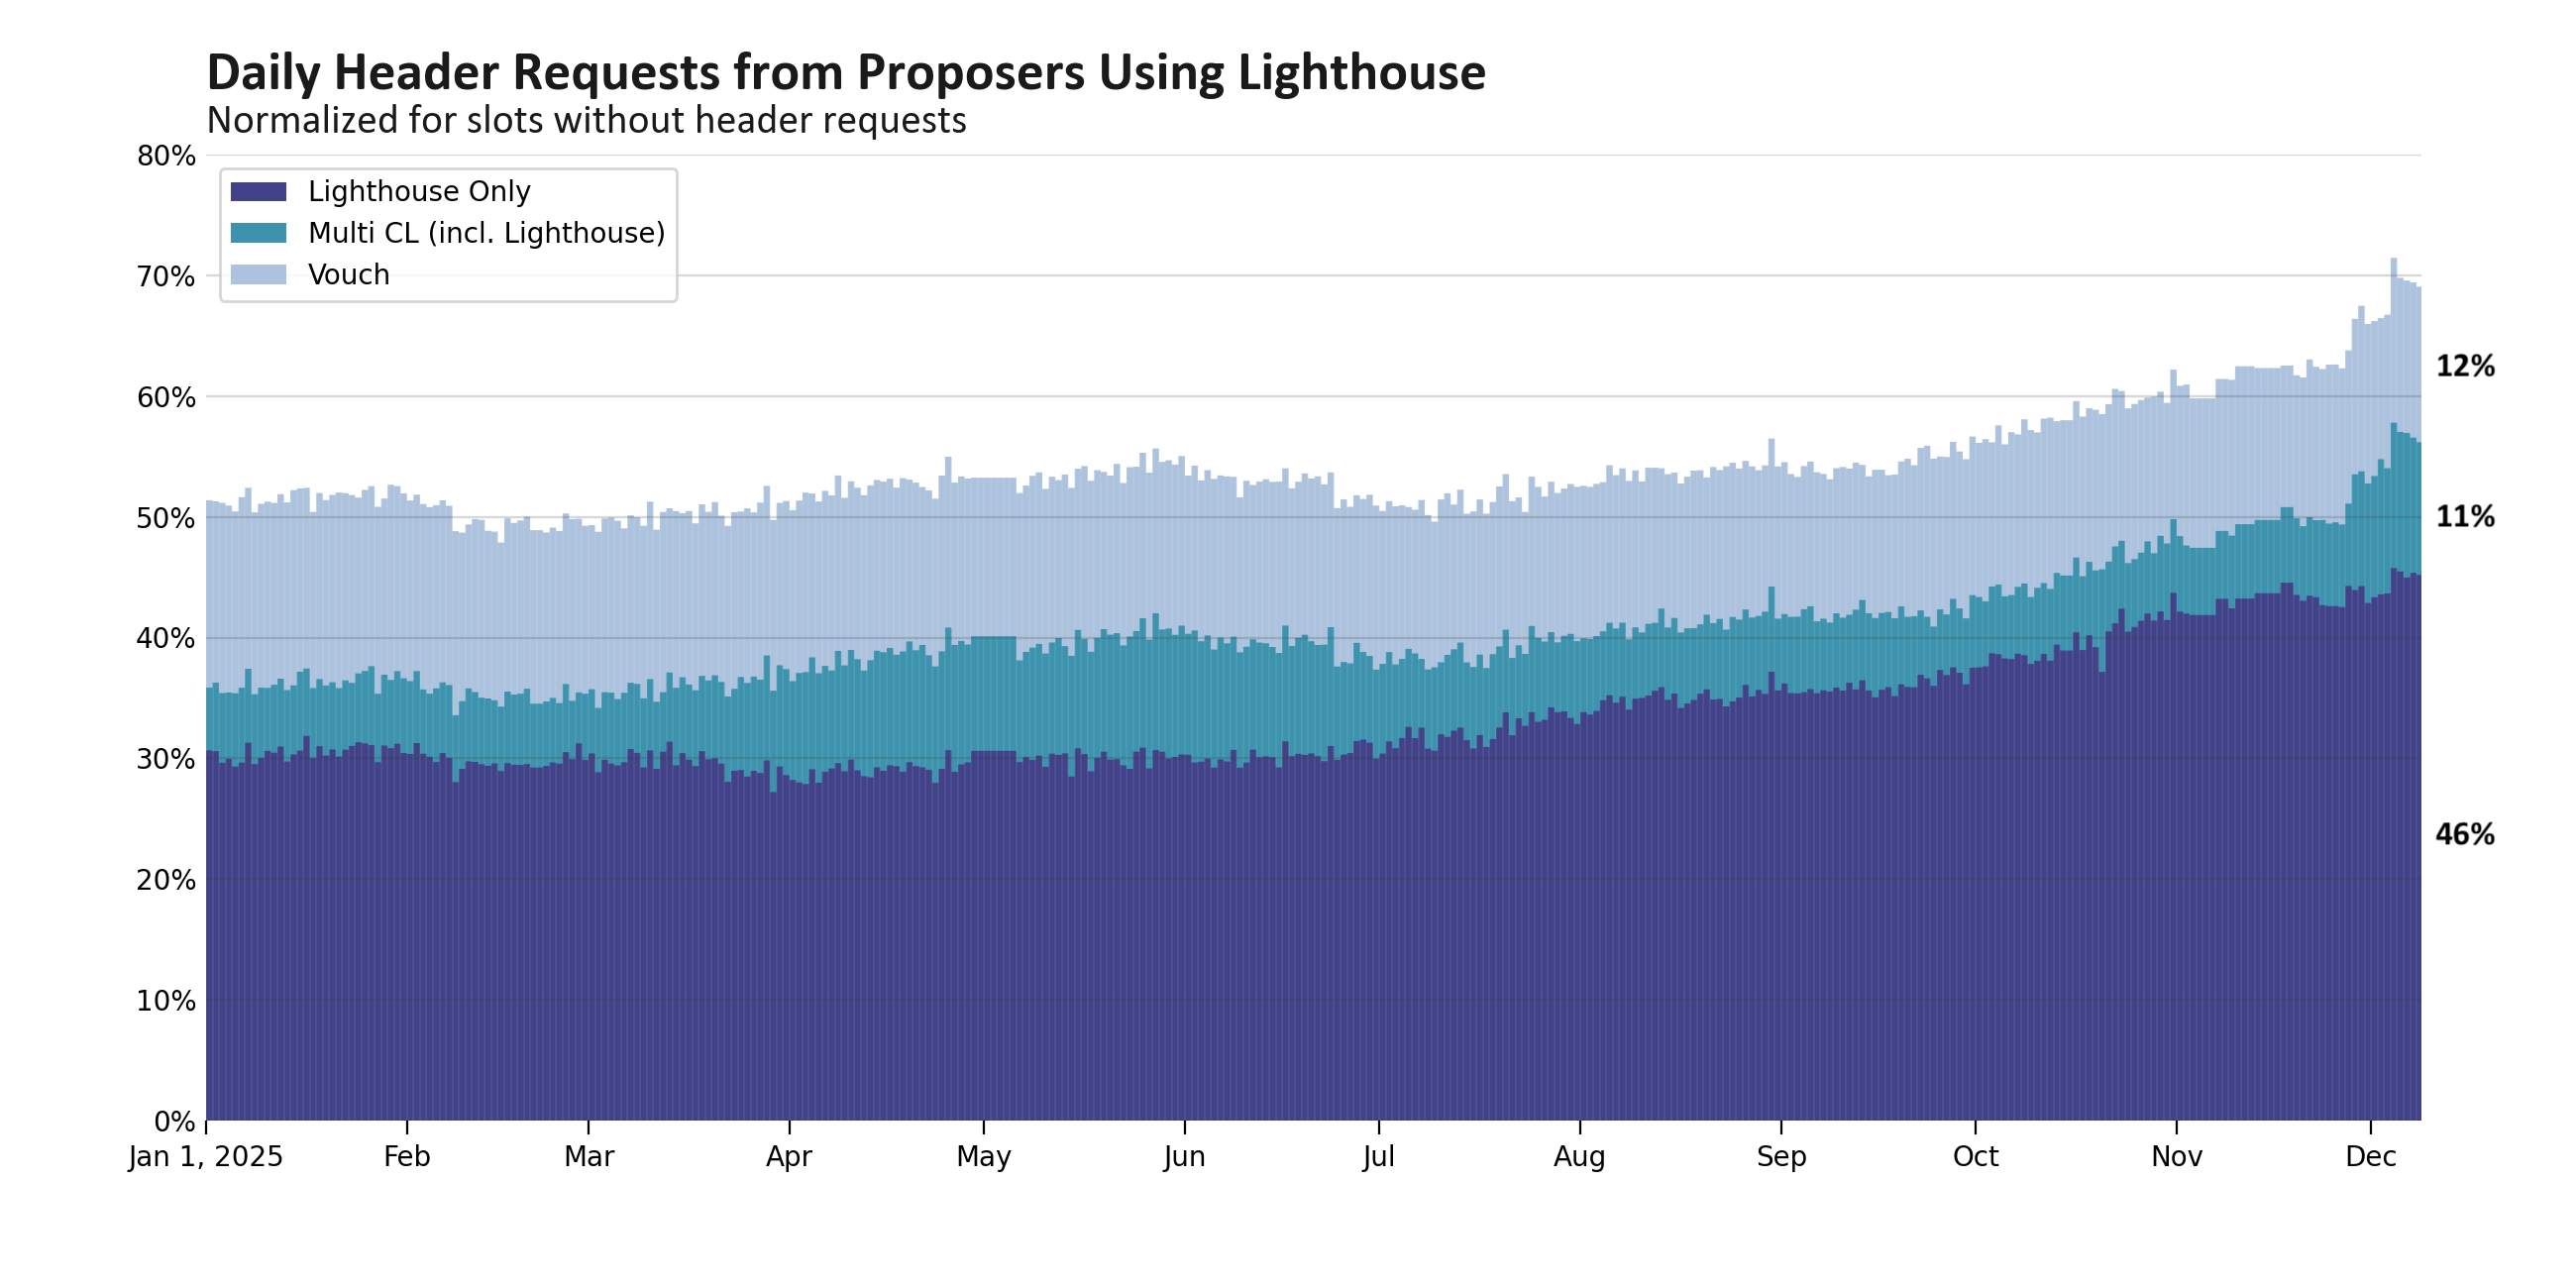
Figure 2: aggregated daily statistics for proposers using the Lighthouse consensus layer client at the Flashbots Relay. These statistics are normalized and only represent slots where the Flashbots Relay got any requests from the proposer.
Of particular note, in the wake of Prysm’s Fusaka outage, we have not observed a meaningful increase in Lighthouse usage over the past two weeks.
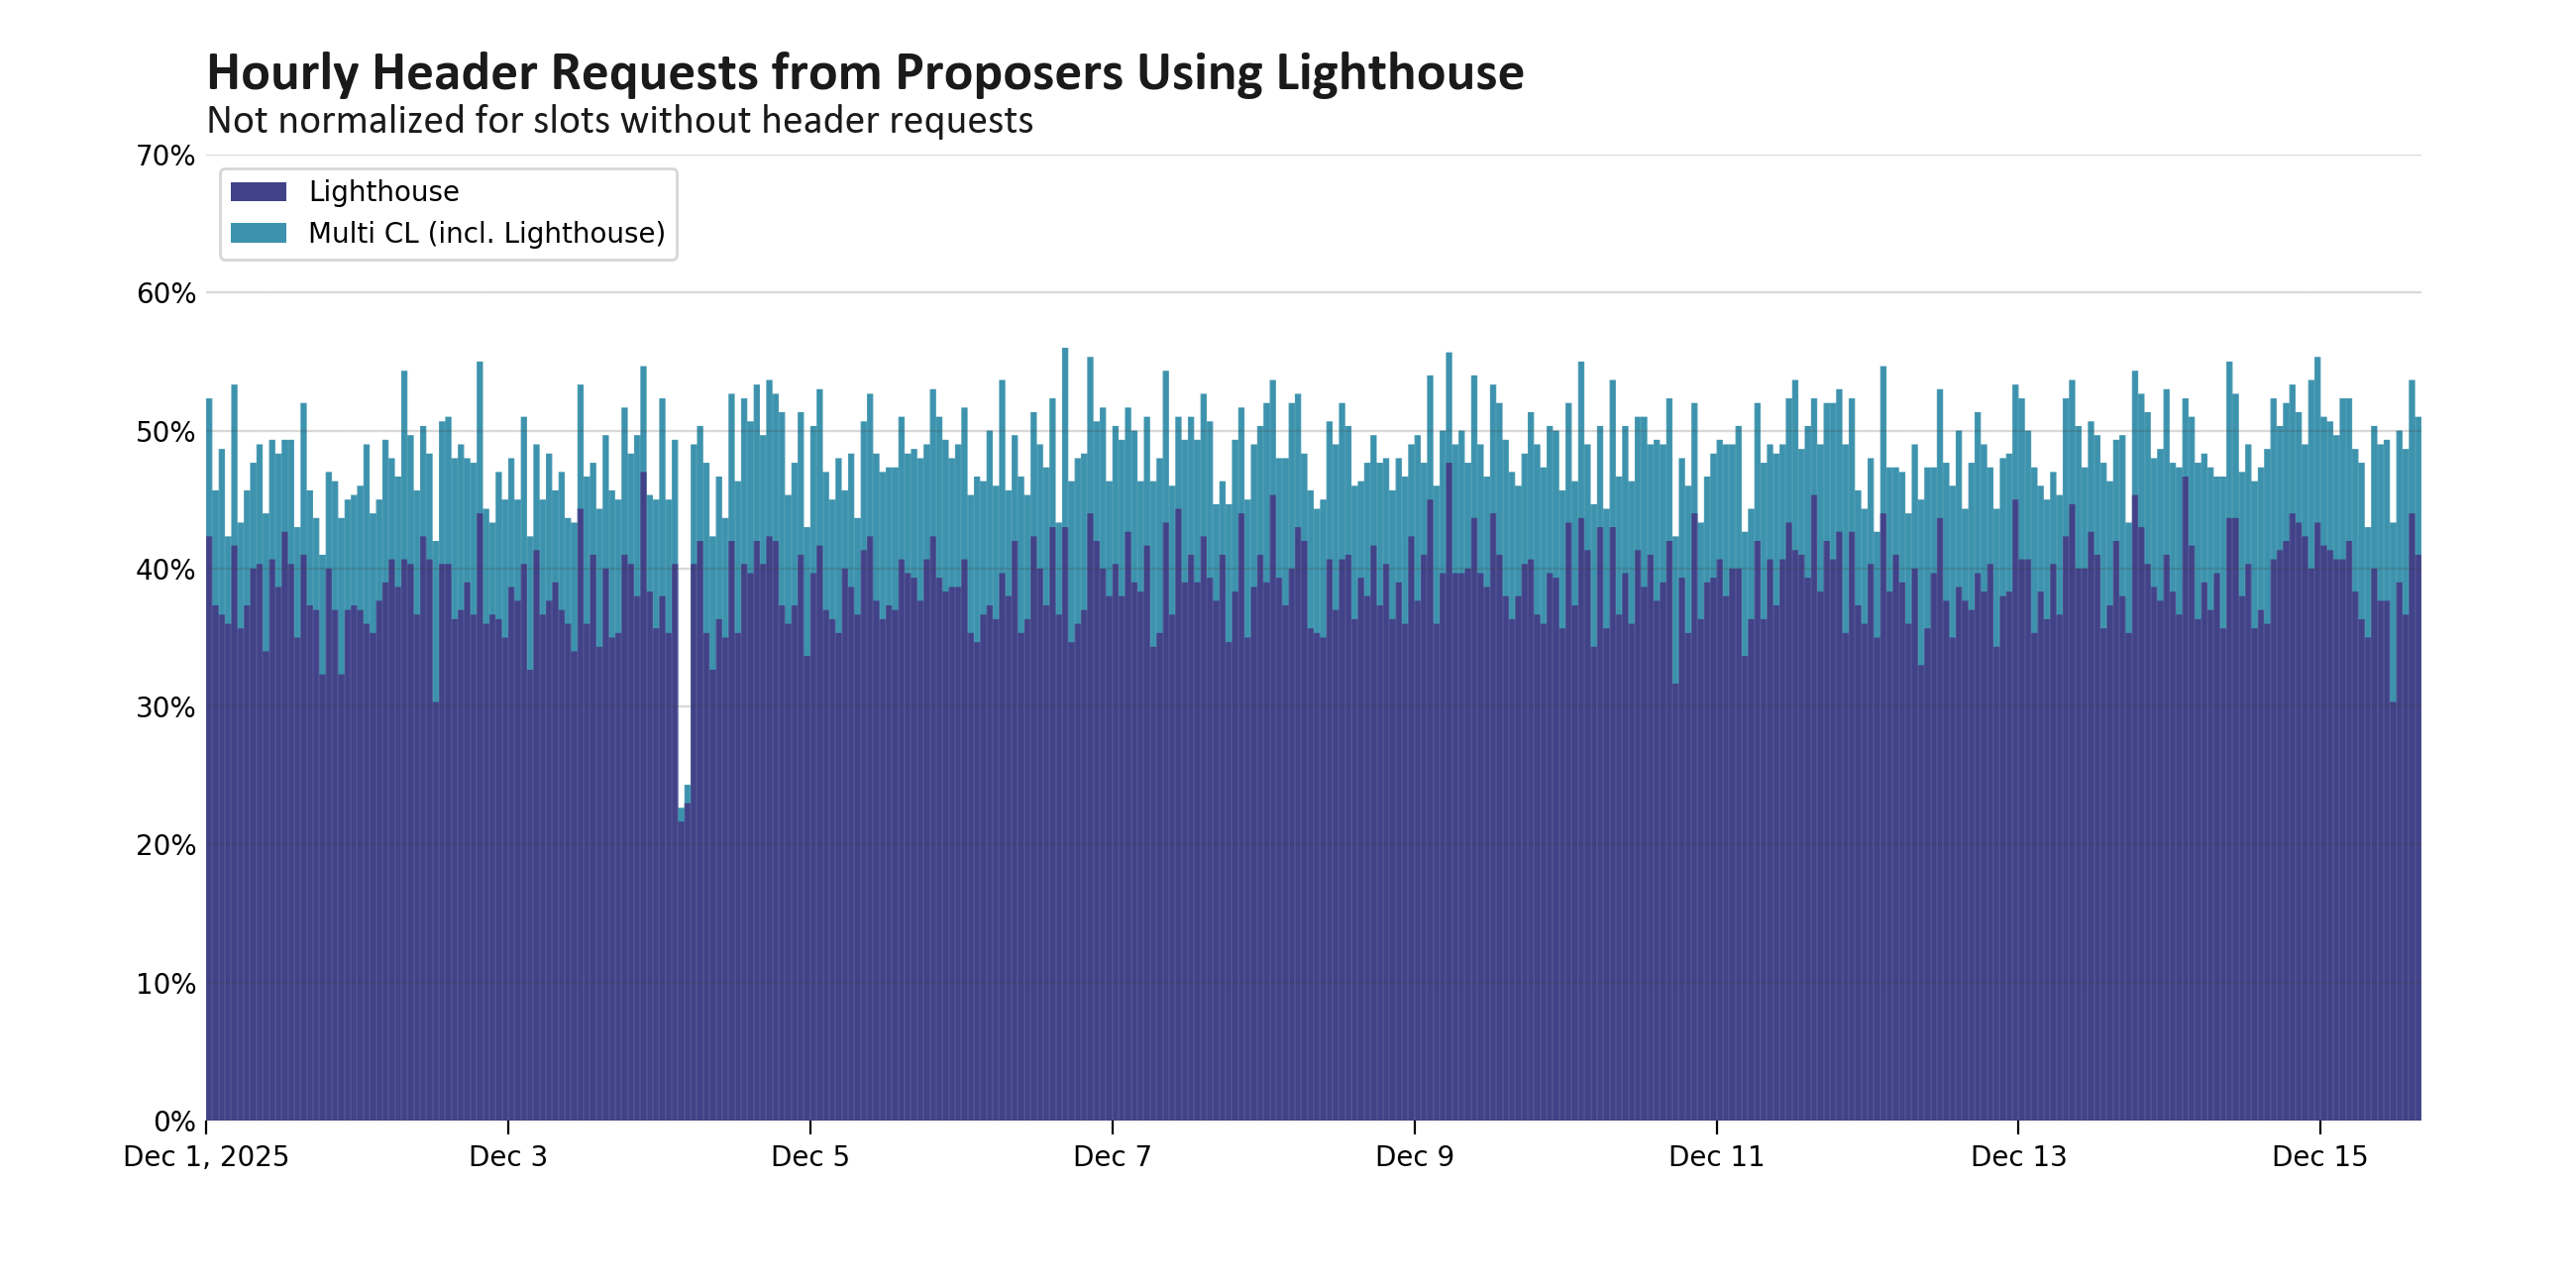
Figure 3: aggregated hourly statistics for proposers using the Lighthouse consensus layer client at the Flashbots Relay. These statistics are not normalized for slots where the Flashbots Relay did not receive any requests from the proposer.
For Prysm, we saw the opposite trend: the share of slots with any Prysm usage fell from 50% at the start of the year to 38% today. Approximately half of those slots come from proposers who exclusively use Prysm, while the other half is split between Vouch and multi-client validator technologies.
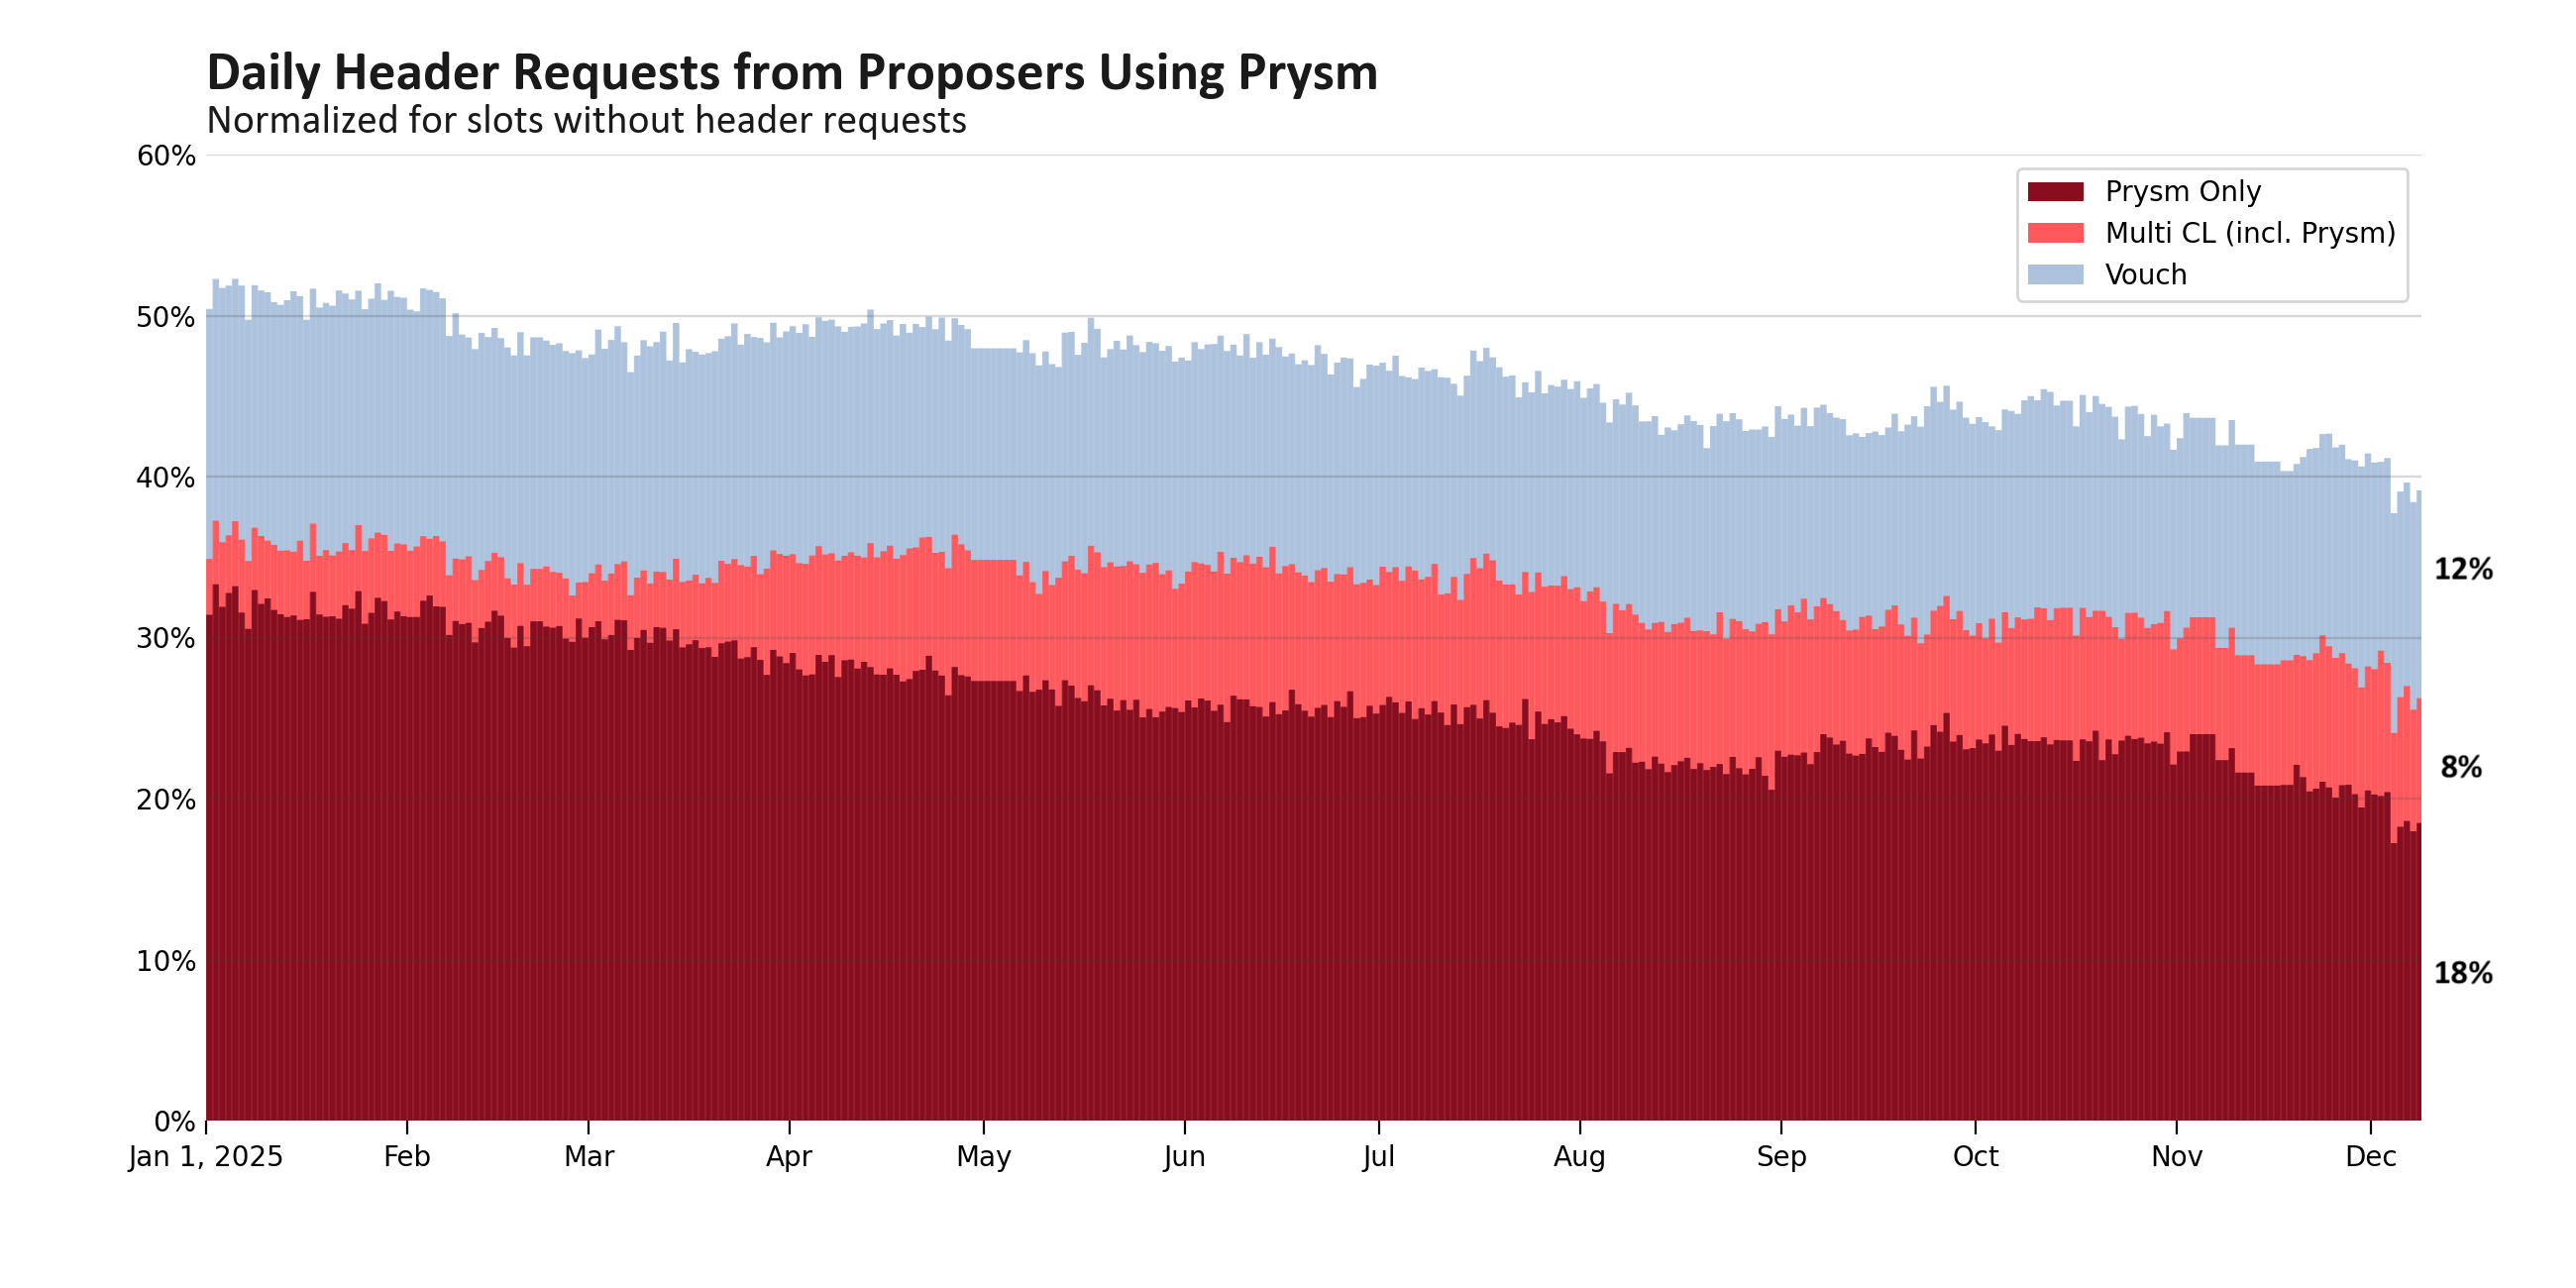
Figure 4: aggregated daily statistics for proposers using the Prysm consensus layer client at the Flashbots Relay. These statistics are normalized and only represent slots where the Flashbots Relay got any requests from the proposer.
The Flashbots Relay saw a surge in Teku usage early in 2025—driven by changing relay-usage patterns among validators, but finished the year with a market share similar to January 2025.
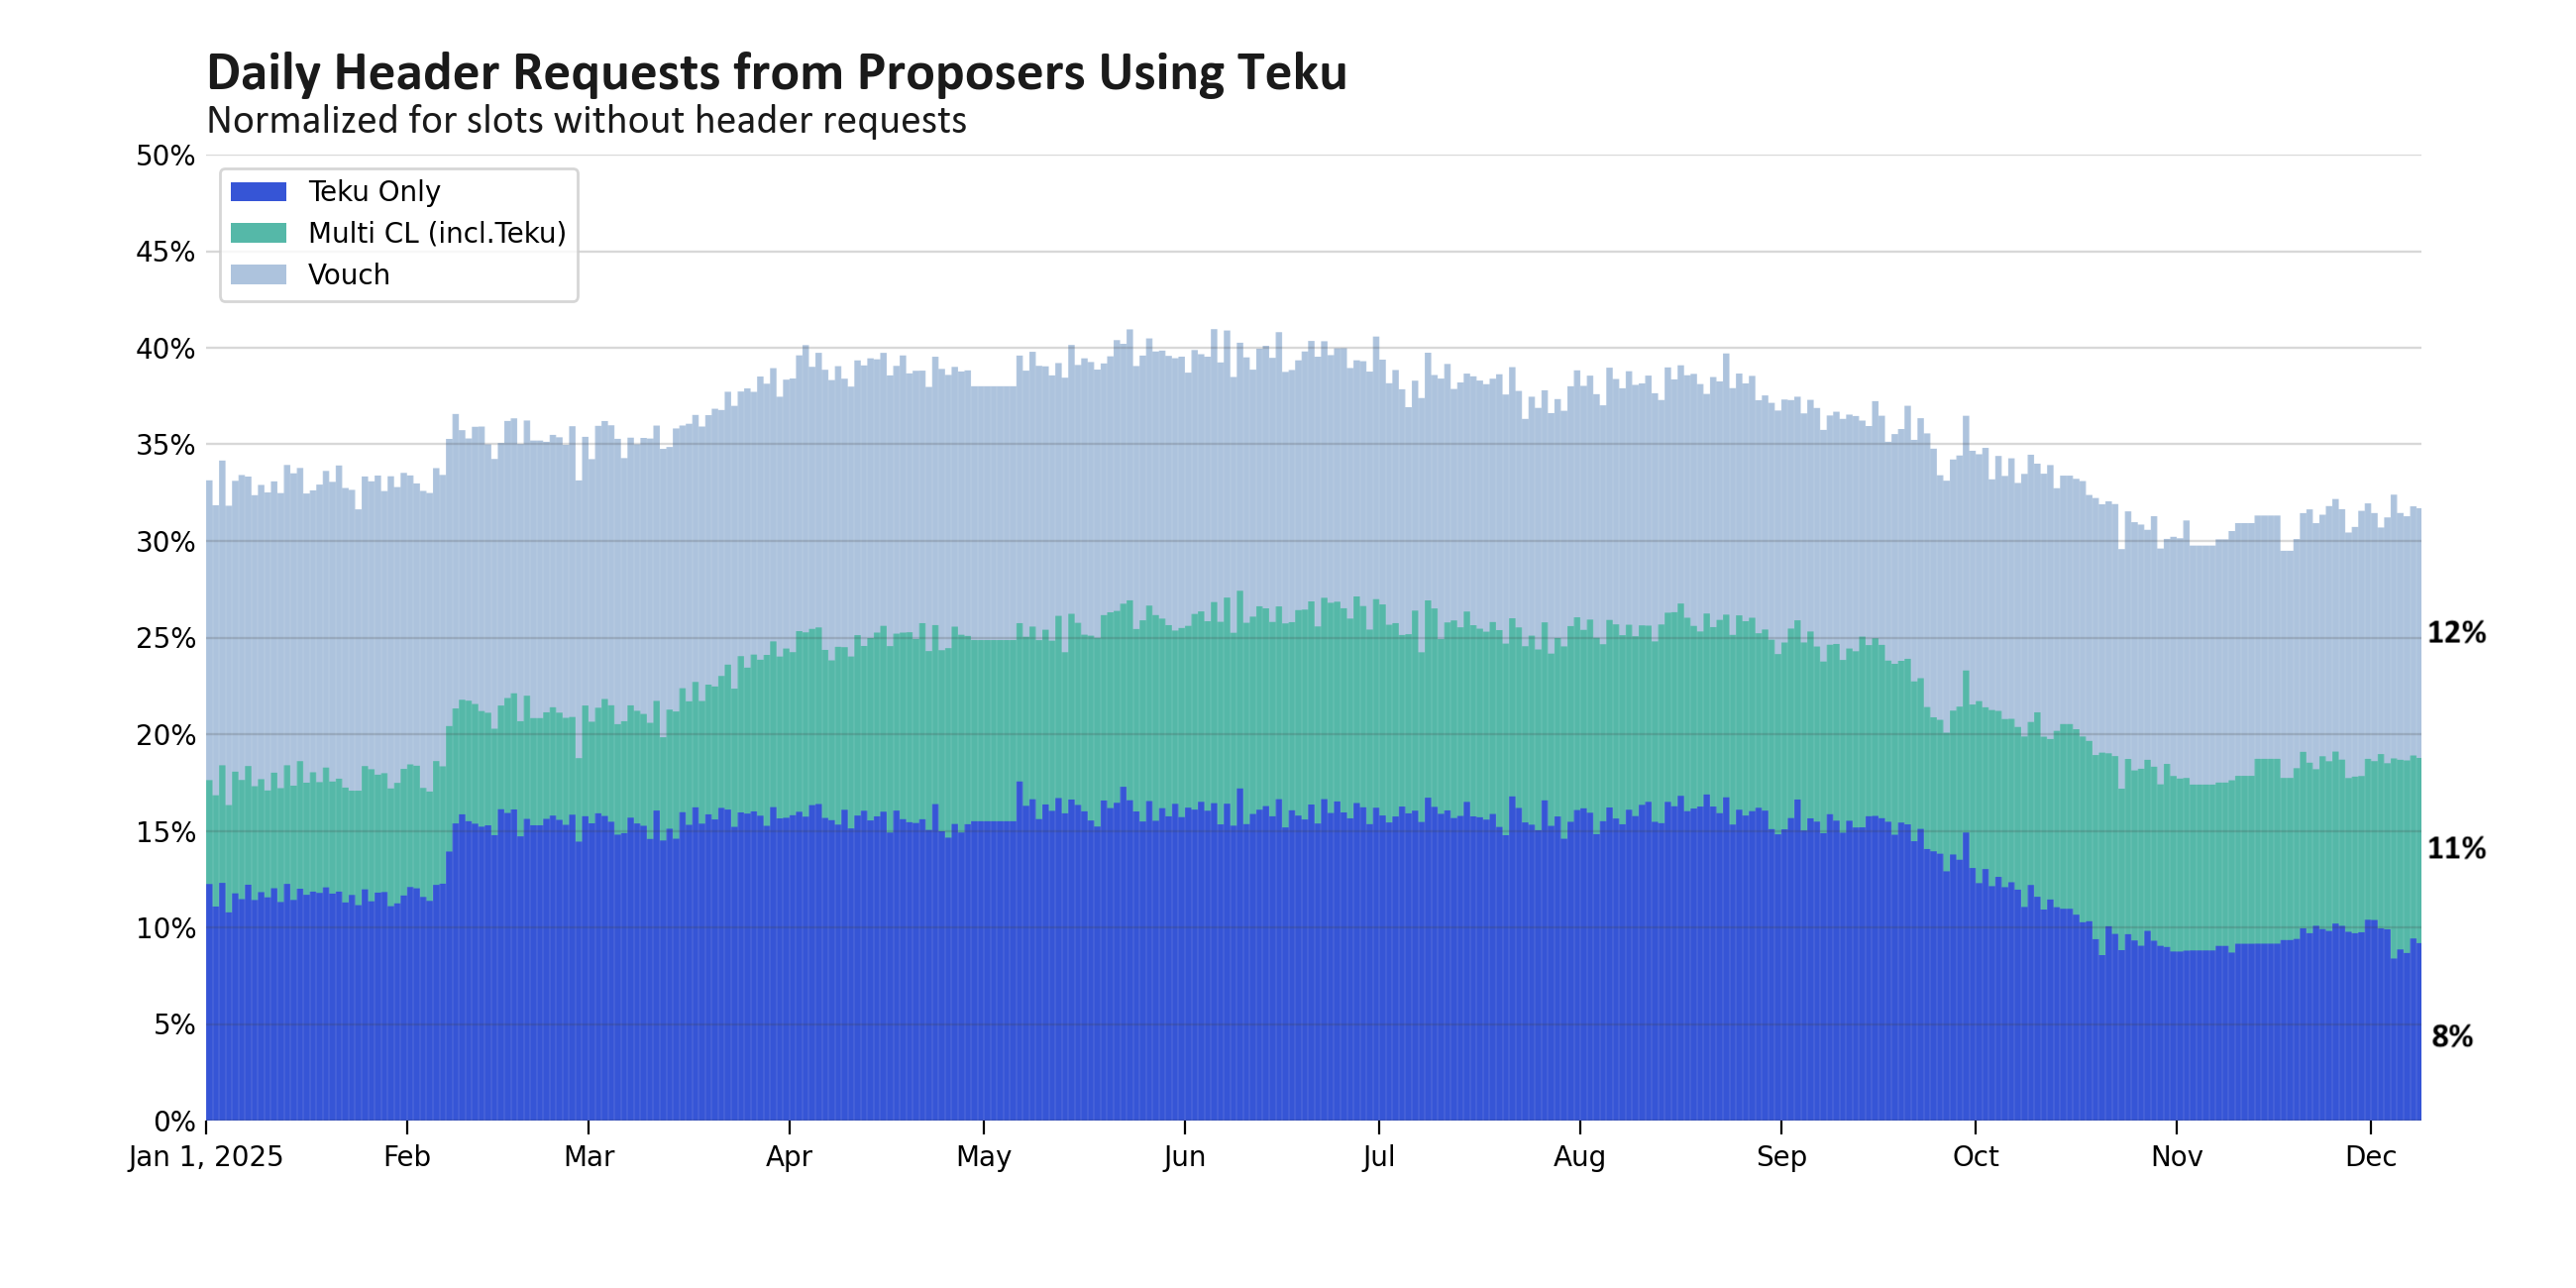
Figure 5: aggregated daily statistics for proposers using the Teku consensus layer client at the Flashbots Relay. These statistics are normalized and only represent slots where the Flashbots Relay got any requests from the proposer.
We can go one layer deeper into DVT statistics. Taking the last 5,000 slots where proposers chose to embed either a variant of ssv.network or charon in their graffiti field, we cross-reference that data against header requests to the Flashbots Relay. We received header requests in 88% of these slots.
Of the slots with DVT graffiti in which the Flashbots Relay received at least one header request:
- 38% of the time one consensus layer client was used
- 46% of the time two consensus layer clients were used
- 14% of the time three consensus layer clients were used
- 2% of the time four or more consensus layer clients were used
When only a single consensus layer client was used:
- 67% of the time the consensus layer client was Prysm
- 30% of the time the consensus layer client was Lighthouse
- 3% of the time the consensus layer client was Teku
- <1% of the time the consensus layer client was Nimbus or Lodestar