Alright, after weeks of reviewing the whole methodology and results and re-running everything, here we are!
I am excited to announce that below are the results for Optimism and Arbitrum. Polygon will come a bit later.
NB 1: Note that this is just a summary, more details are provided in the paper (particularly distributions, analysis of the top tokens, and number of transactions).
NB 2: I am very dubitative about posting numbers here without any explanation about the methodology or limitations etc as this can easily be subject to vehement critics. So I am going to start with this. Also note that we have a dump of the DB in case someone is interested in reproducing the results. We are also humans and error prone, so feel free to double check, give feedback etc. The code is public.
I. Methodology
We are using mev-inspect-py with Marlin’s modifications to analyze logs rather than traces, it is:
1/ way faster
2/ simpler because we look for swap events and do not need to add the ABI of all DEXes out there
We are focusing on classic atomic token arbitrages and as such our results are only representing one part of the extracted MEV, we do not include token sniping at launch, NFT sniping/arbitrage.
We are fetching prices from UniswapV2/V3/Quickswap/Sushiswap to get the USD profit at the time of the trade, meaning we are able to get block precision prices.
II. Limitations:
Note that fetching the price at the time of the block means that the computed profit does not always represent the realized profit, but rather the mark to market profit, as profit taken in non stablecoins tokens may quickly evaporate as prices move. Also note that block granularity is less precise than tx granularity, but this would require to replay all the transactions one by one within the block, something really long and cumbersome when looking at all blocks from block 0.
Also, we are getting the price of the token vs USDC, so if there is no pool of the token vs USDC, then we will exclude this arbitrage tx from the analysis. (A great improvement would be to look at token vs native chain token, i.e. ETH, MATIC, ARB, OPT).
We haven’t done any modification to the classification heuristics of mev-inspect-py as the goal is to get a good baseline for comparison with Ethereum results that can be found on https://explore.flashbots.net/. It is to note, however, that the classification methodology are flawed and could be improved (looking at eigenPhi’s methodology for example).
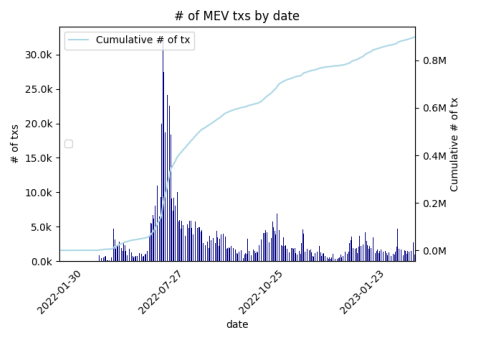
III. Results for Optimism
First let’s look at the number of MEV transactions over time:
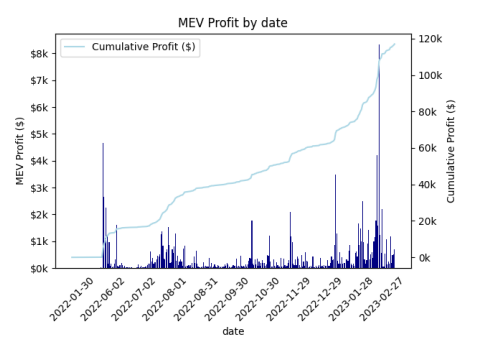
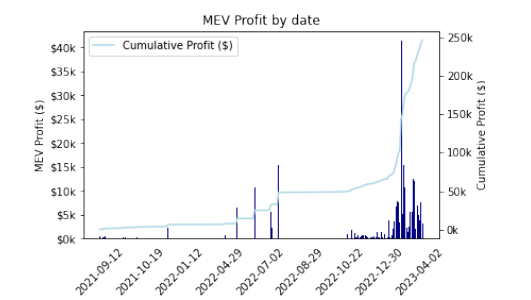
And now the historical MEV profit over time:
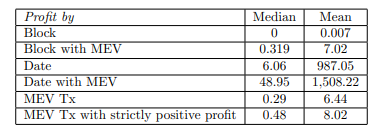
Now, in terms of mean and median MEV profit (USD) by tx, day and block:
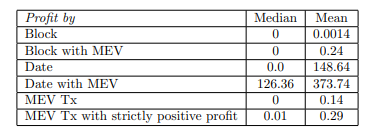
(we did some analysis for all days/blocks and for days/blocks that have MEV in them, the reason is that most of the blocks at the beginning do not have no MEV so they skew the data).
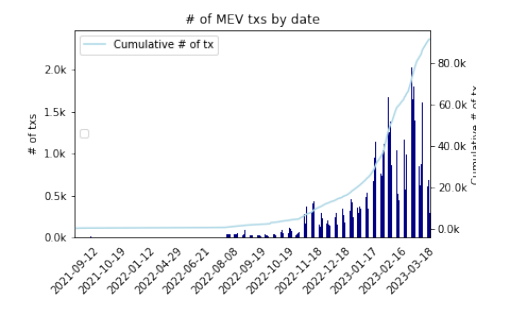
III. Results for Arbitrum
First let’s look at the number of MEV transactions over time:
And now the historical MEV profit over time:
Now, in terms of mean and median MEV profit (USD) by tx, day and block:
(we did some analysis for all days/blocks and for days/blocks that have MEV in them, the reason is that most of the blocks at the beginning do not have no MEV so they skew the data).